Ipad Application

eSCAD

The Executives Smart Scad dashboard is a secure database visualization tool that displays visual indicators produced by the SCAD in a single interface using interactive charts. It provides decision-makers direct access to information about the data source.

  • Project eSCAD
  • date 2017 - 2018
  • disciplines UX / UI DESIGN

01Why need eScad

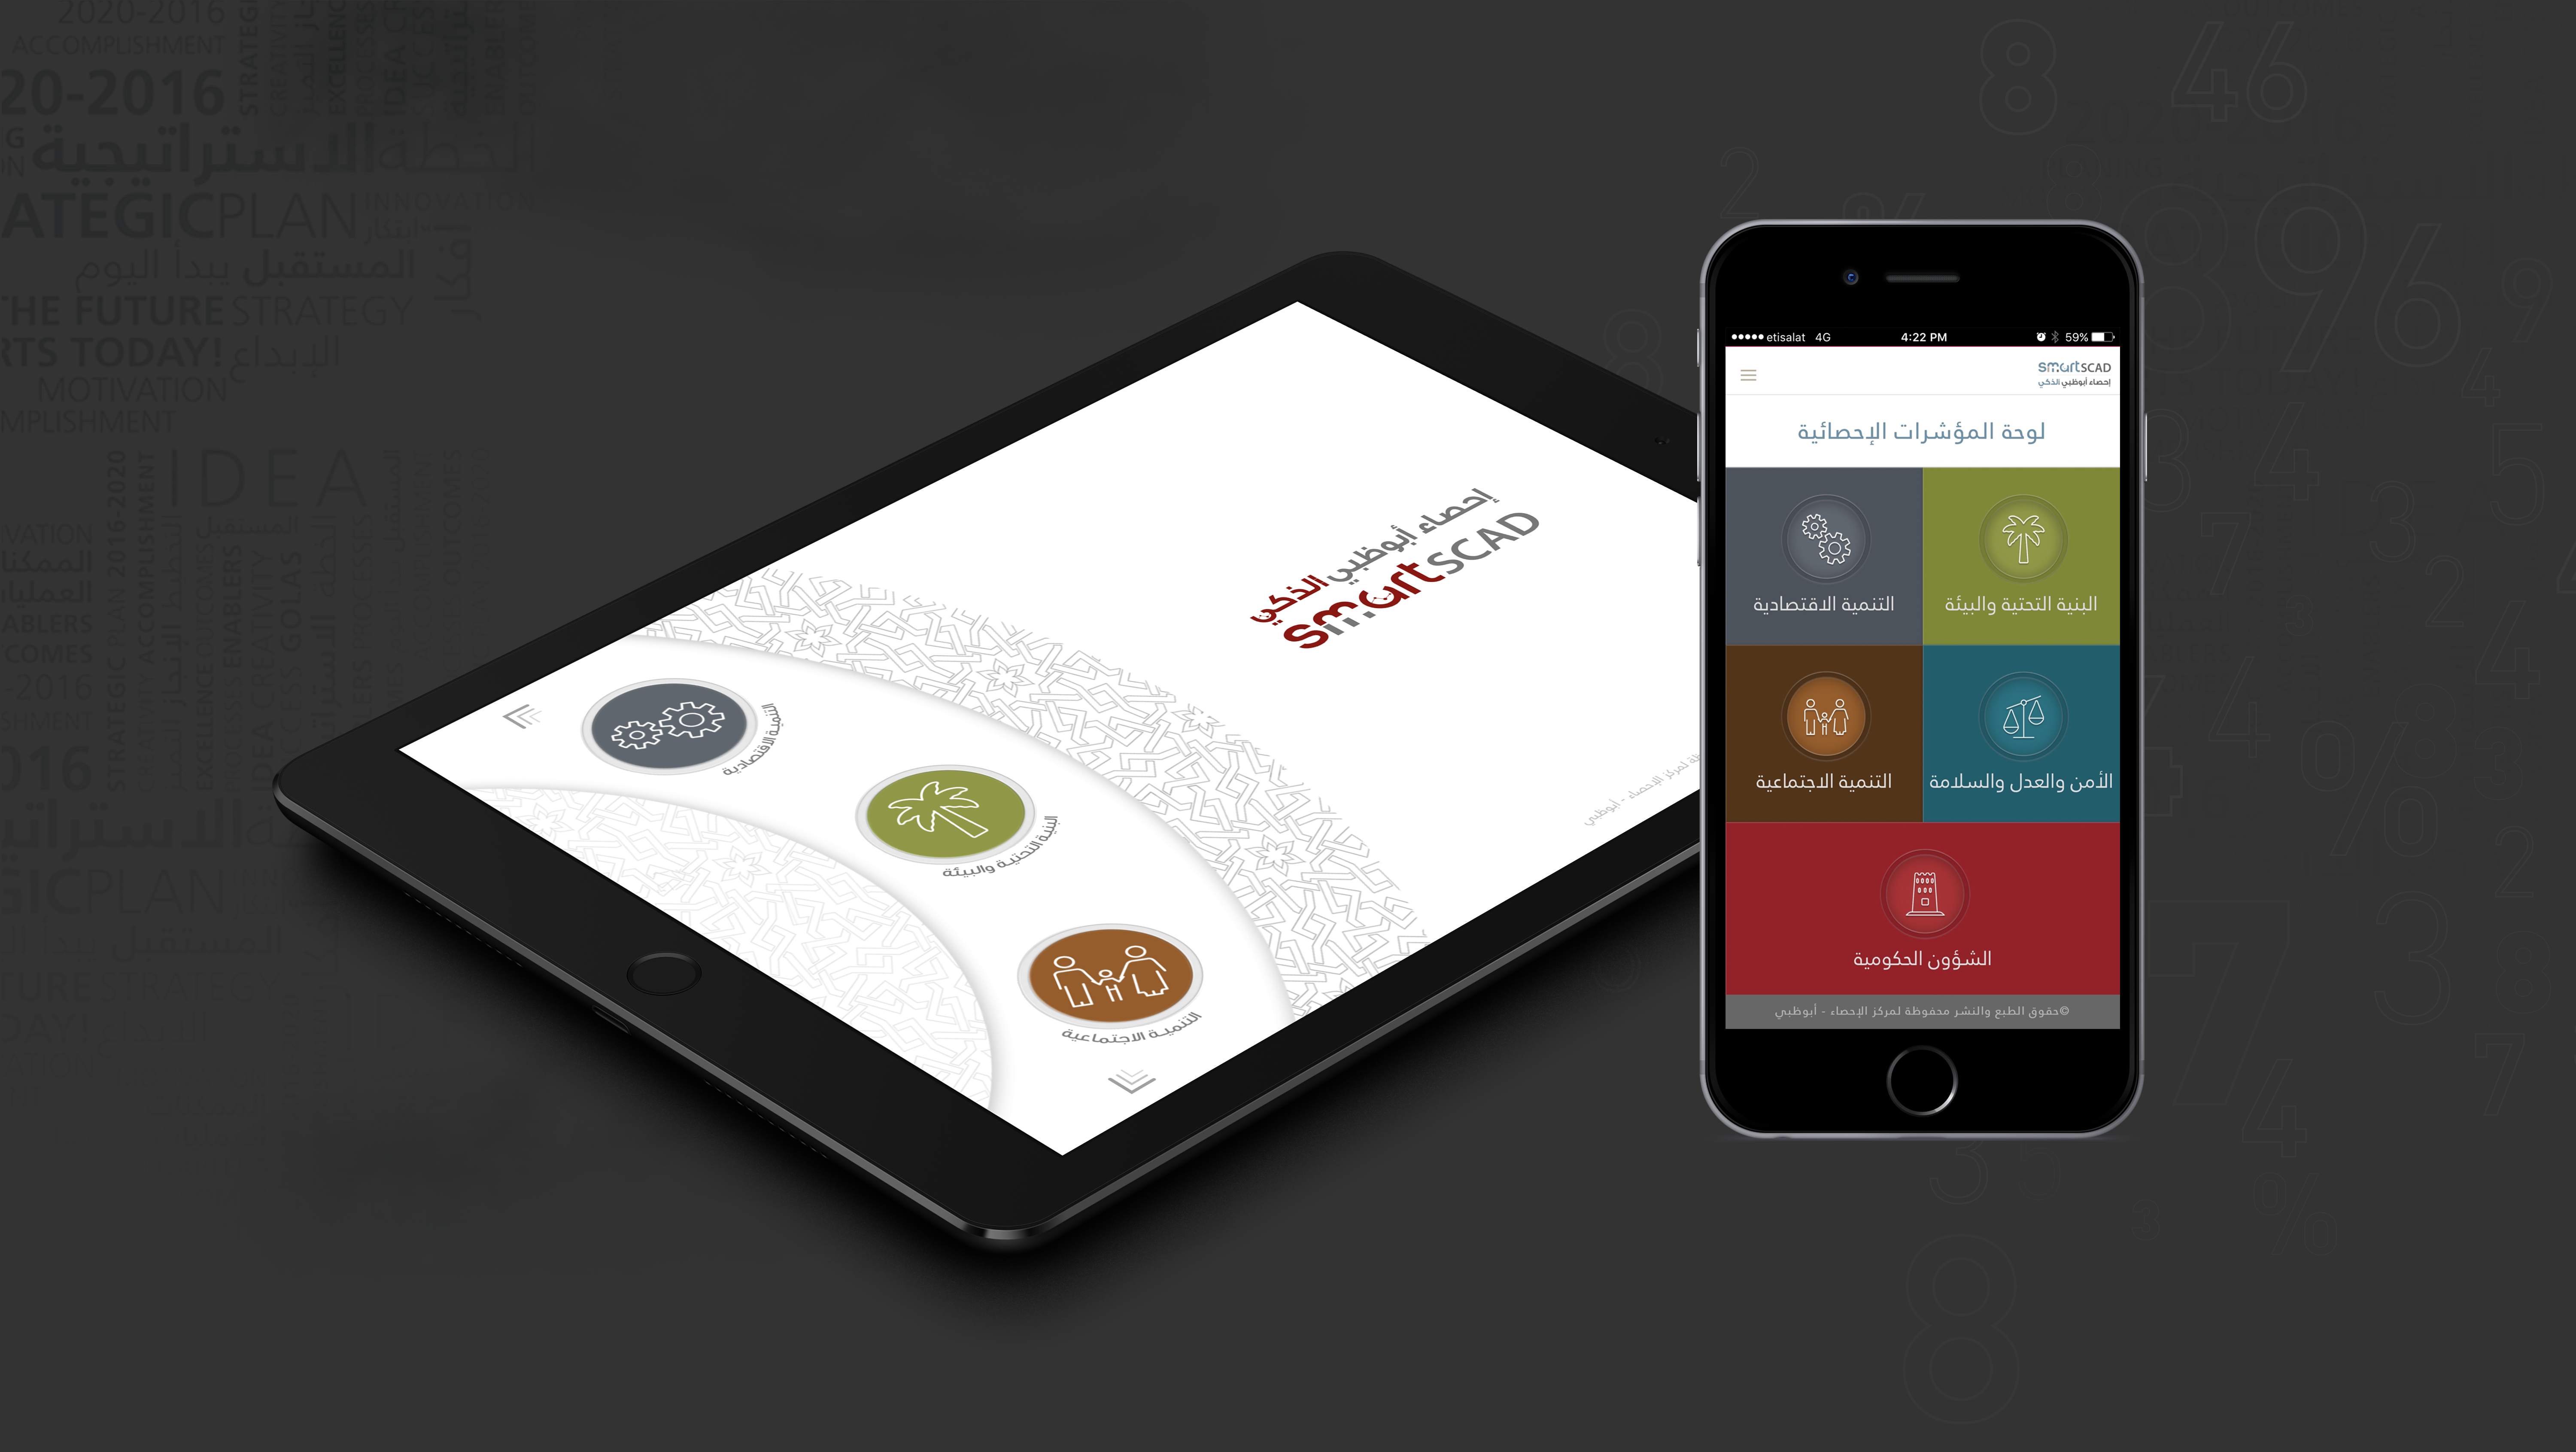
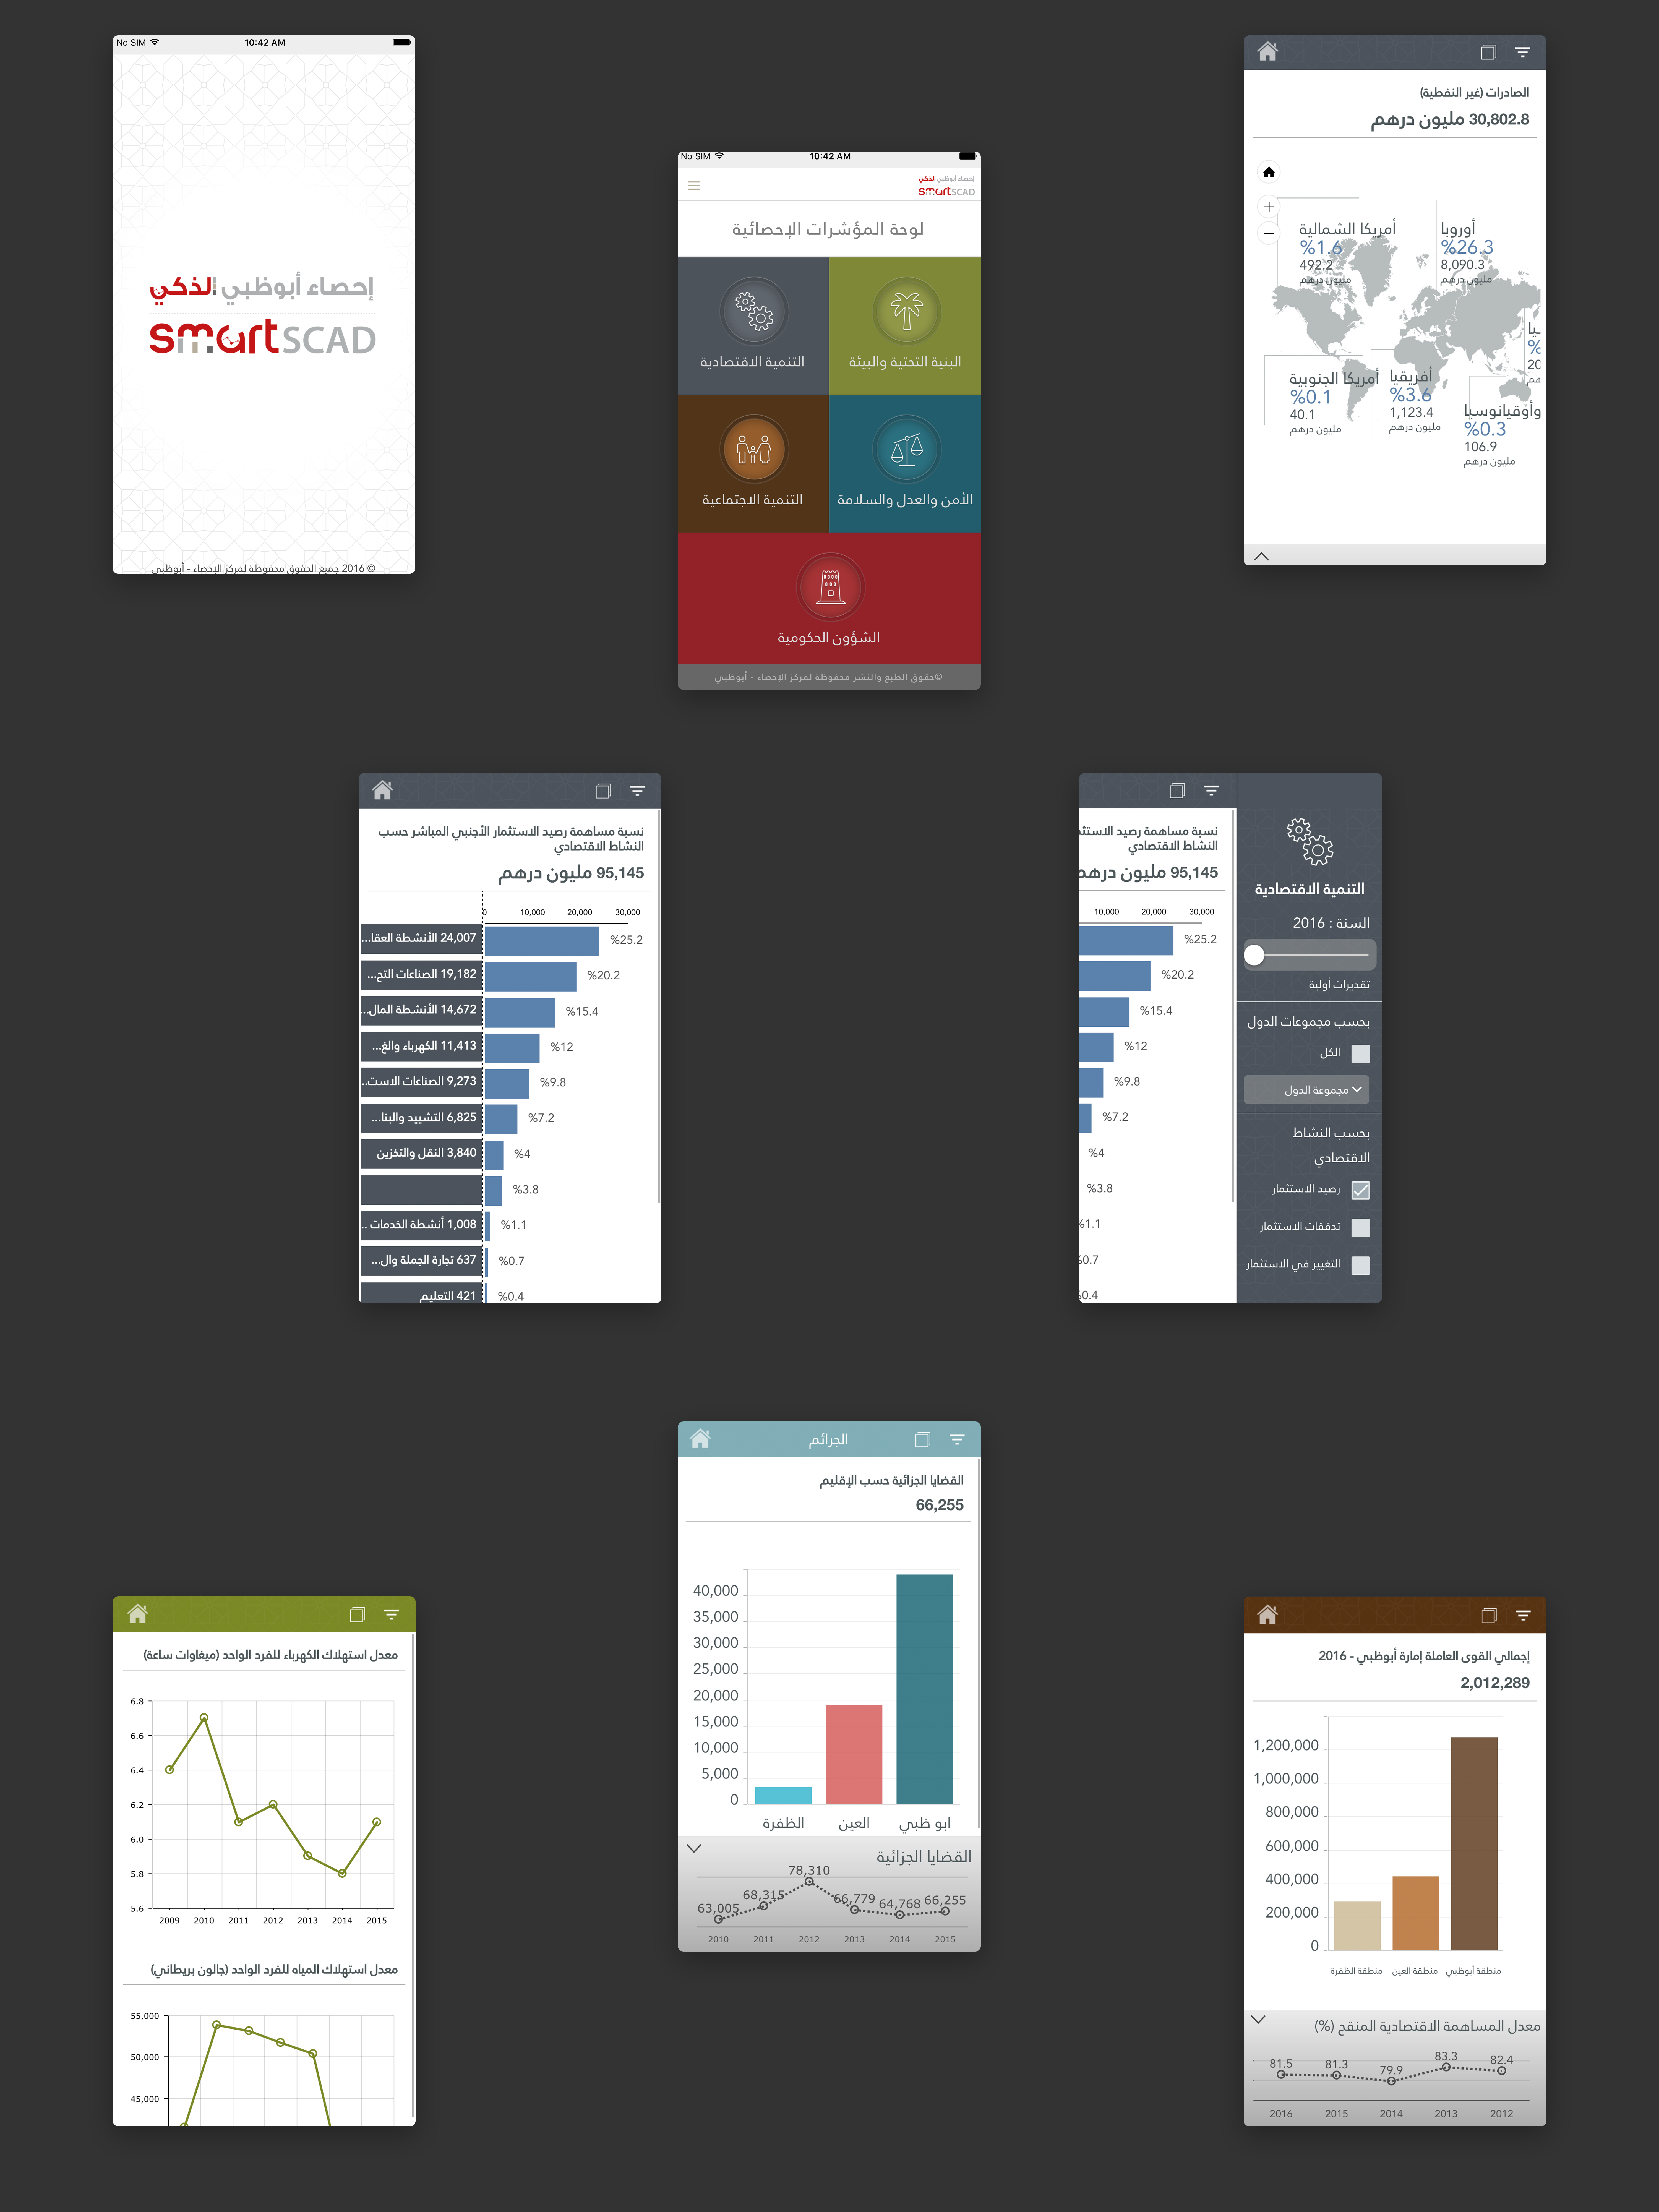
Statistics Centre: Abu Dhabi (SCAD) relies on efficient administrative data collection to produce timely statistics. SCAD also has a strategic vision to provide advanced and innovative dissemination tools.

SCAD is motivated by innovation. In particular, SCAD seeks to apply innovative techniques to the administrative data collection process and the dissemination of statistics. To meet this dual obligation, the eSCAD project was created.

02Understanding the problem

The design of a dashboard should support visual perception rules. For example, the flow of information charts should progress from simple to more complex.

The tool contains pre define key official indicators. Some of them are worldwide standards, and some are for internal use. It's an analytical application that provides data to concerned authorities or organizations to make decisions and forecast the changes based on indicators data. It shows statistical data for different indicators related to the following themes.

Economy, Industry & Business, Population & demography, Social, Labour, Agriculture

03Identification of Problems or Opportunity

Try to understand the context in which users may use a system.

Talking to stakeholders such as product owners and different sector representatives so they can provide insights into business goals and challenges.

Brainstorming to develop an understanding of user needs.

04Understand the challanges:

Create a single centralized interface for all eScad users to view all processed Key performance indicators (KPIs)

Integrate with the central database

Ability to create user-defined maps/graphs

Strong navigation to search the specific information

05Key recommendations:

Since users’ needs differ, the eSCAD Statistical Dashboard allows customizing by filtering. For example, data can be filtered for a specific region, school type, citizenship, etc.

Design an innovative, graphical tool to provide information related to various themes such as population, education, health, happiness, economy, agriculture and environment statistics. Decision makers at the highest level can seek real-time statistical information about population, education, health, happiness, economy, and agriculture to make informed decisions.

06Strategic Response

The Statistics dashboard tool provides an ‘at-a-glance’ view of statistical indicators on population, foreign trade, hotel establishments, foreign investment, education, and more.

The dashboard supports the presentation of complex data but in an easily consumable way.

Provide more contextual experiences

The Statistical Dashboard was designed to allow interactivity between different indicators. For example, if a user selects an economic activity in a chart in the GDP dashboard, the same action will be automatically highlighted elsewhere.

Graphs do communicate large amounts of data effectively but also add to the cognitive load. Thus they must be used only when absolutely necessary. Key metrics can also be presented in textual format.

07Ideations & Solutions

Focus on data flows from apparent sources and wherever the data information brings that data. Still, we look holistically across the system to see how these themes interoperate and interact.

I create colour theme bases designs so users can easily understand which part of section graphs they are.

08Design Process

Execute interaction design and visual design principles.

Create UX deliverables: wireframes, functional specifications, site maps, and user journeys.

09Evolution

It took multiple rounds of user testing and many iterations for the display summary theme for individual categories. Along the way, I worked with the data visualization engineering team, defining new advanced features for them to implement, such as the ability to show graphs and maps. The final result was a simple, clean, and visually driven single-page theme summary that showed only the most critical insights and allowed leadership to dive deeper if required.

ECONOMIC STATISTICS

Economic development and reform in the Emirate of Abu Dhabi is of significant importance to the leadership. The Abu Dhabi economy has advanced immensely, and has grown to be competitive regionally and internationally.

POPULATION & DEMOGRAPHIC STATISTICS

This section presents a wide range of population and demographic estimates for the Emirate of Abu Dhabi, including population estimates and characteristics by region; birth- fertility- and mortality rates and marriage and divorce statistics.

AGRICULTURE & ENVIRONMENT

Statistical data on the agriculture, environment sectors is important in decision support, as indicators for most economic activities and as the basis for sustainable agricultural development planning that seeks to support food security, while preserving the environment.

06Results

Leadership recognizes the system for its attractive, clean, and simple interface. The system requires no dedicated training. Even though the interface is simple, the eSCAD Statistical Dashboard can still present a large amount of data clearly and cohesively, which is impossible from standard data tables.

next project

Smart Scad