Web Application

Smart Scad

As the UX/UI designer, I designed Smart Scad, an in-house web platform that brings everyday work into one place. Staff, department and section heads, and office management use it to manage tasks, short leave requests, HR recruitment, employee performance and more, instead of juggling separate systems.

Smart Scad was built for the Statistics Centre – Abu Dhabi (SCAD), the official statistics agency of the Emirate of Abu Dhabi.

  • Project SMART SCAD
  • date 2016 - 2017
  • role UX/UI DESIGNER
  • disciplines UX / UI / HTML
  • team 20 PEOPLE
The problem

Staff and managers juggled separate stand-alone tools and manual steps for everyday work.

What I did

Researched both groups, designed separate employee and management flows, and brought every service into one interface.

The outcome

A platform staff could use with no dedicated training, praised by leadership for its clarity.

01The problem

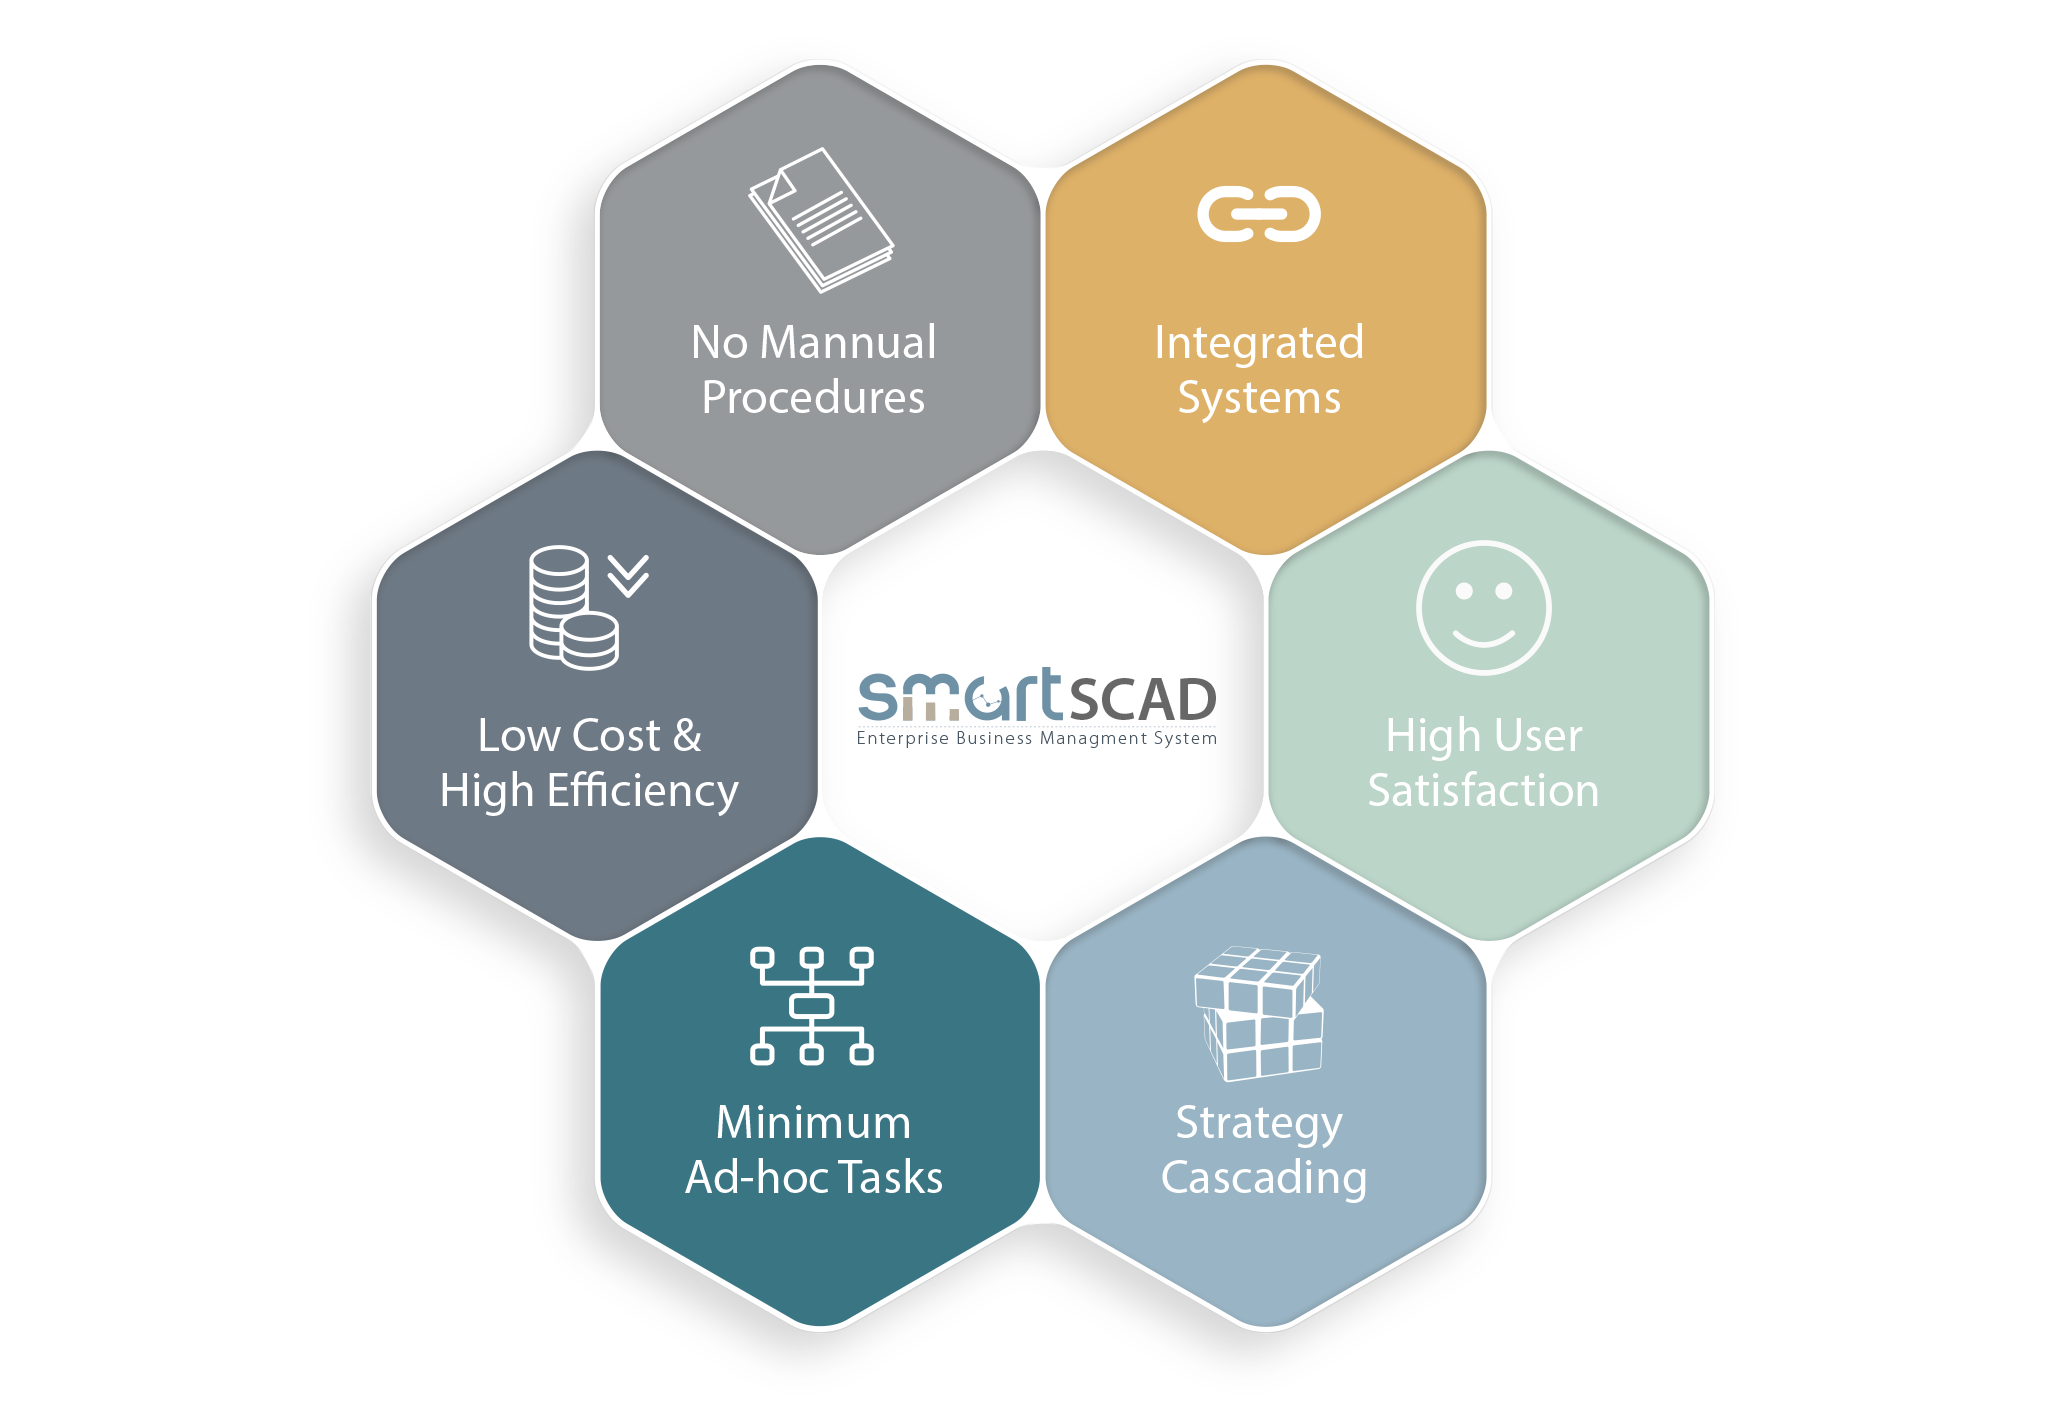
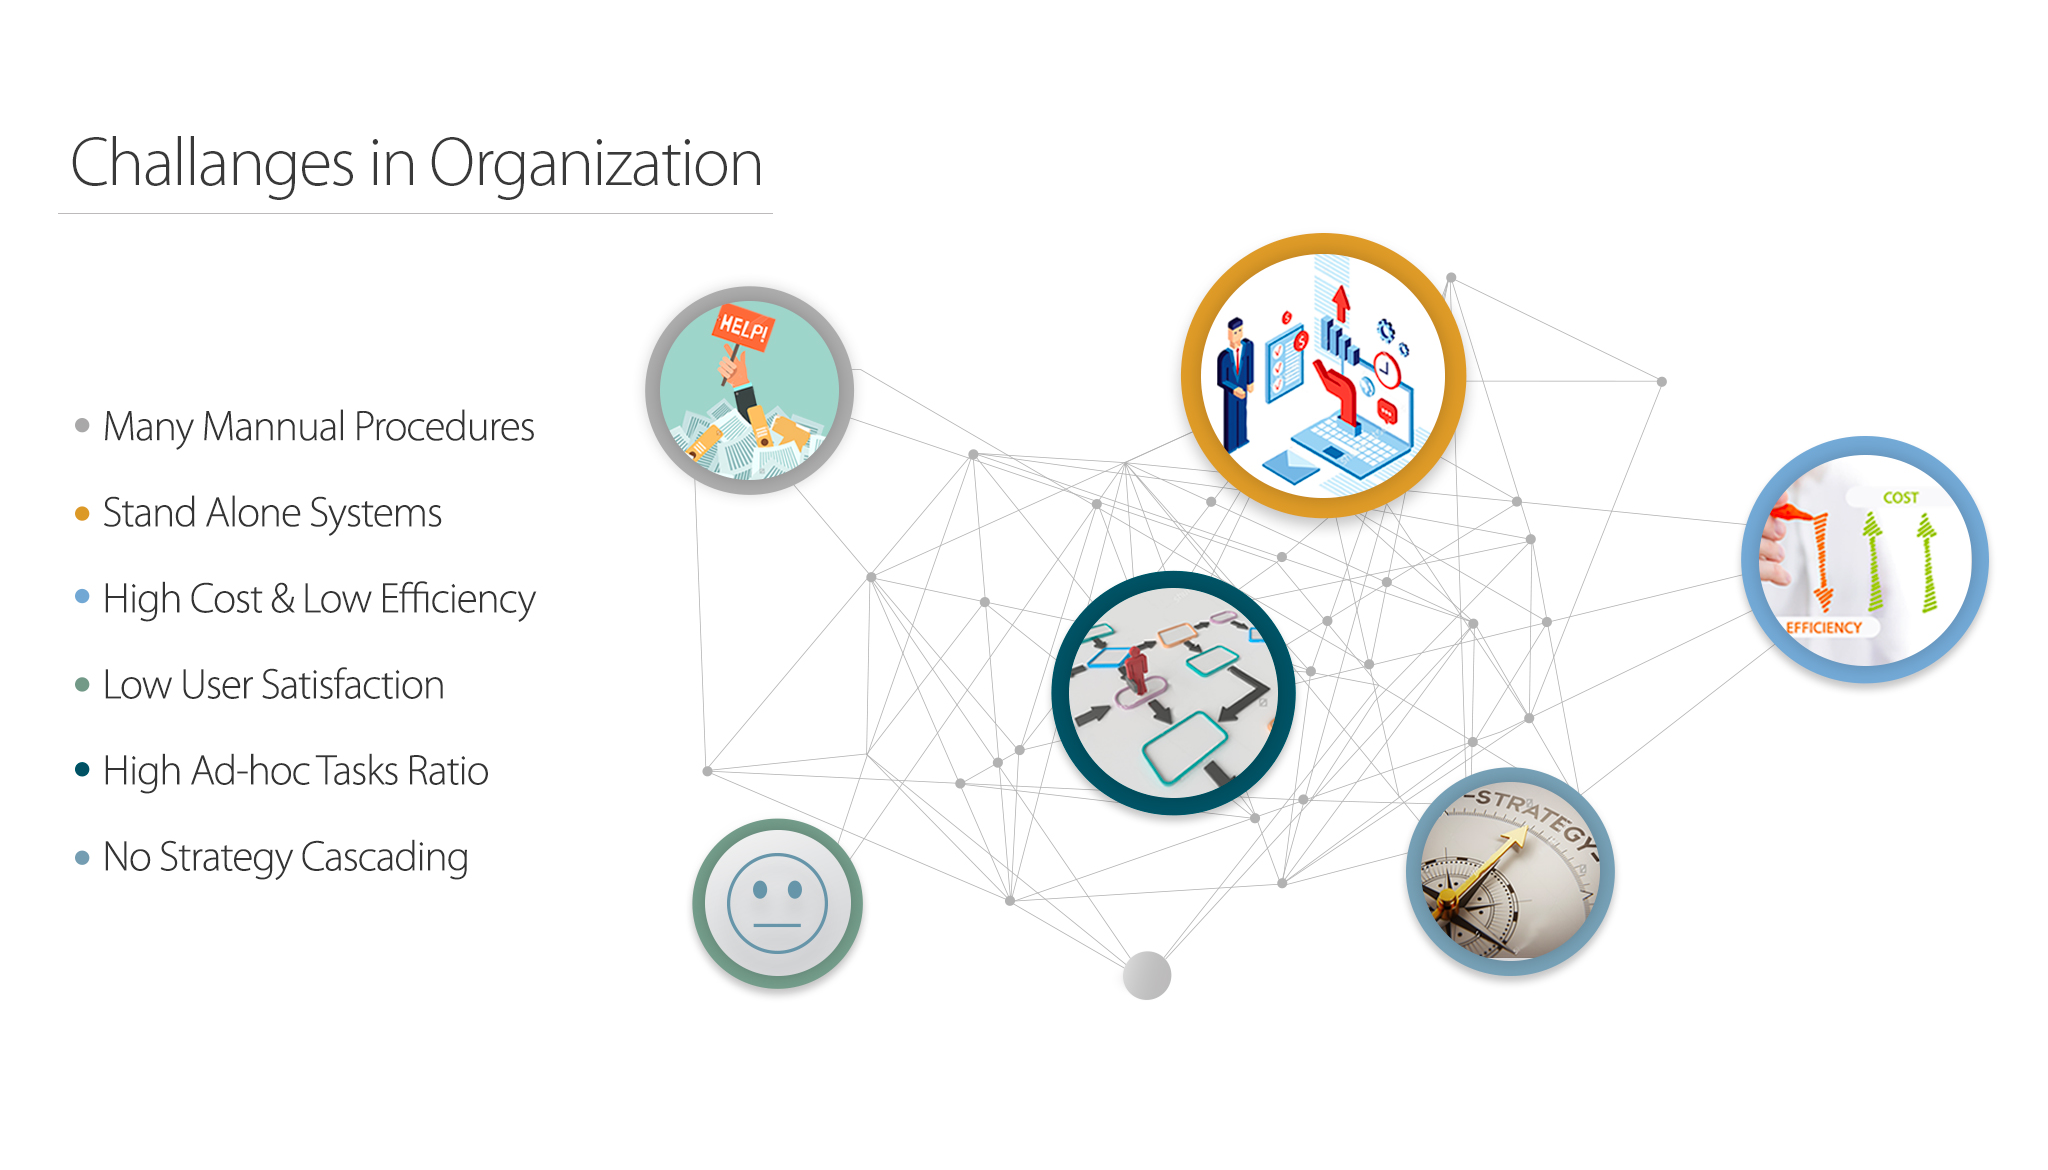
There was no single platform for daily work. Employees and management relied on different stand-alone tools to complete tasks and submit requests. The result:

  • Manual procedures and high costs
  • Low efficiency and low user satisfaction
  • Many tasks handled ad hoc
  • No way to cascade organizational strategy down to daily work
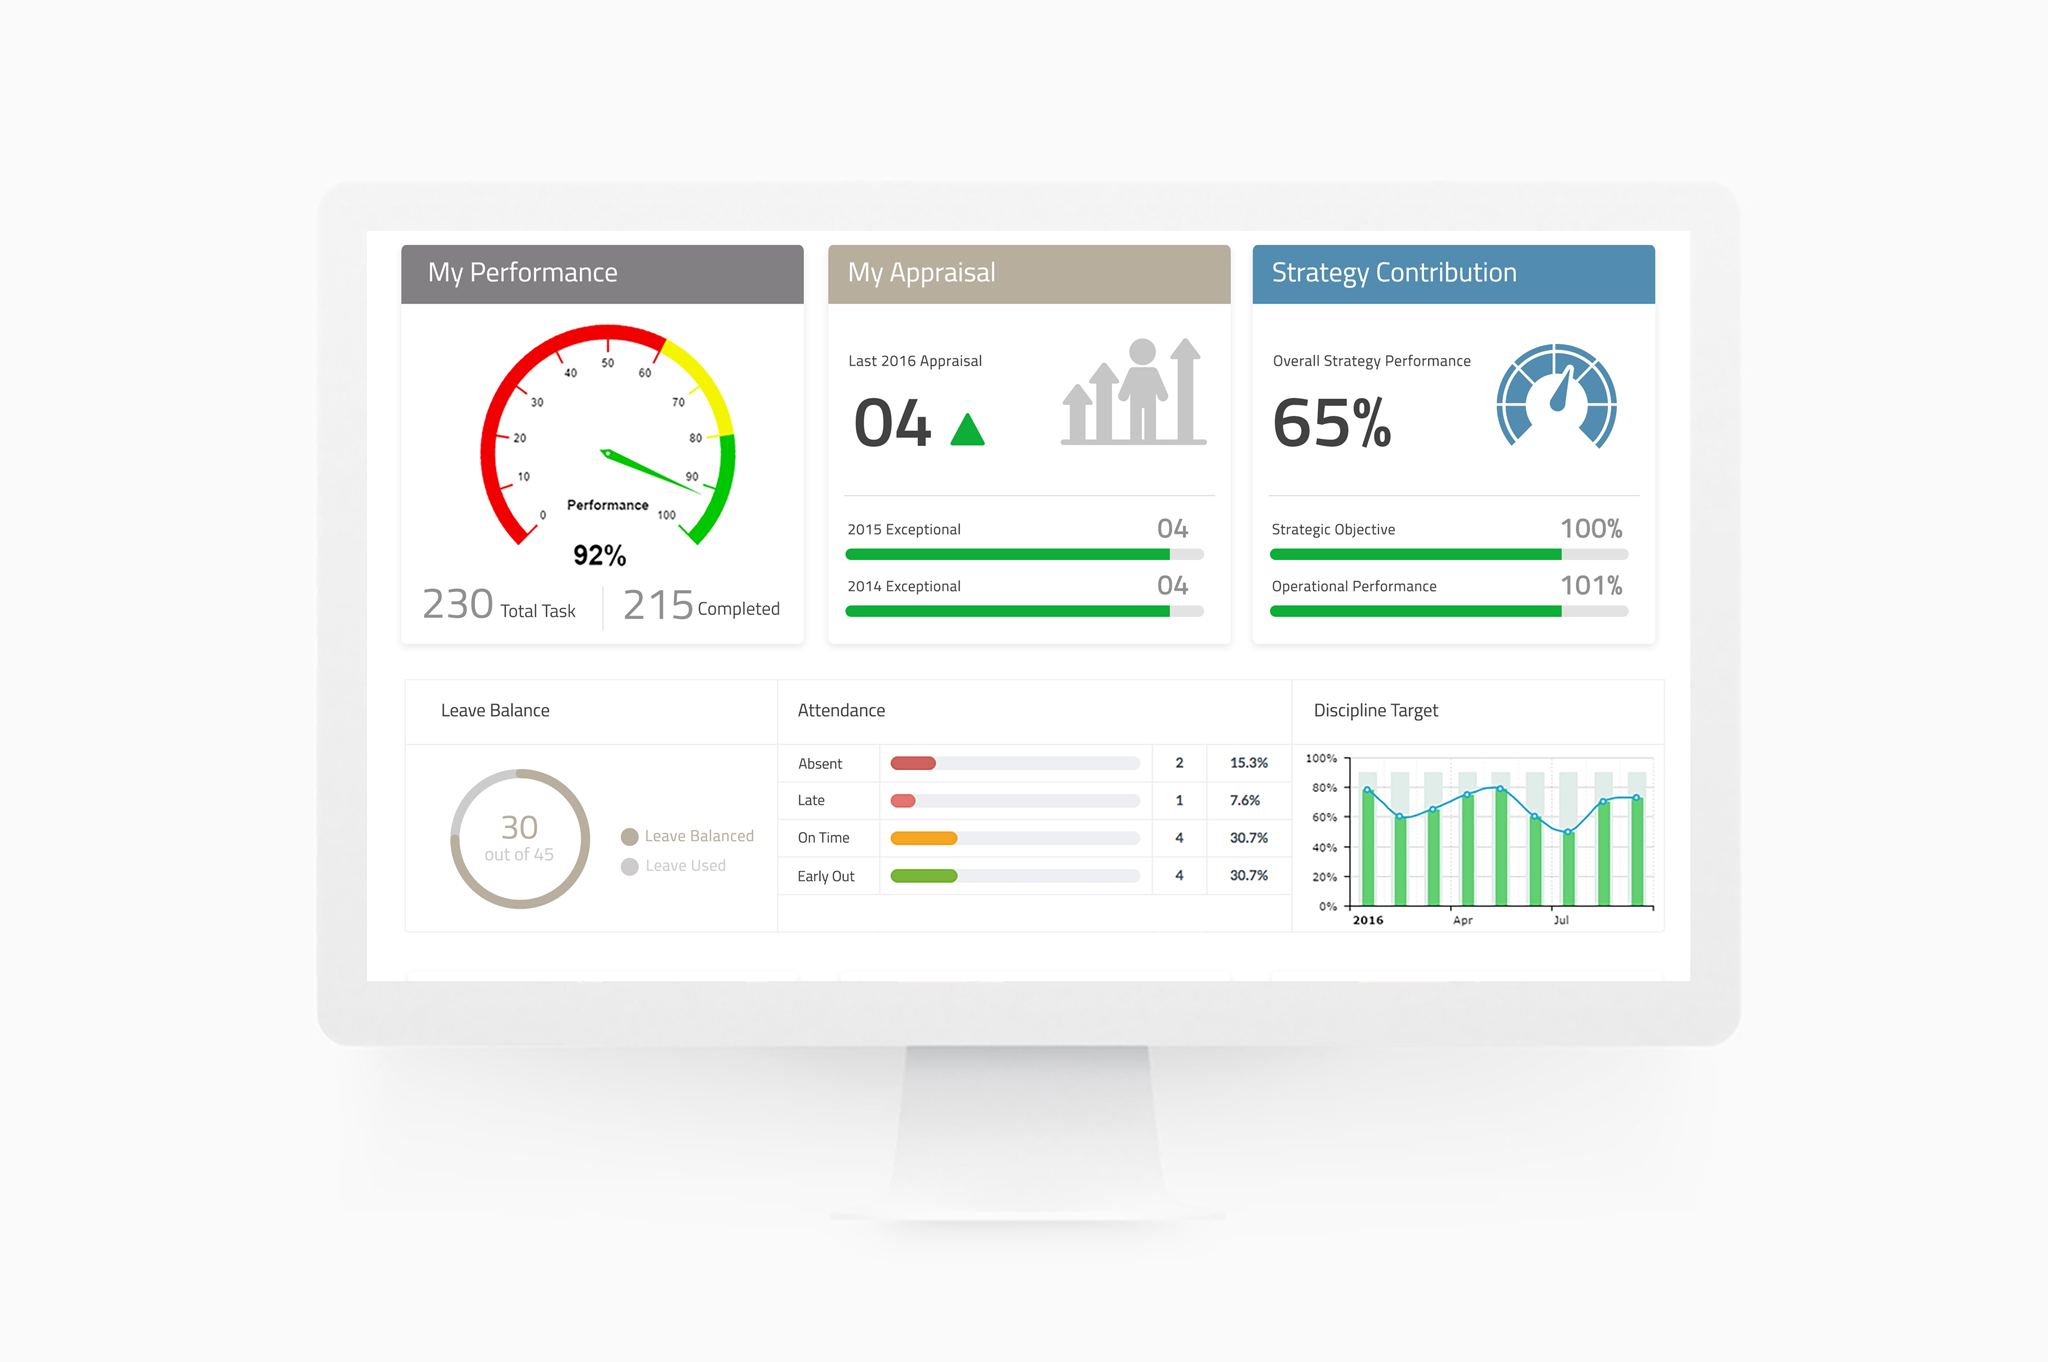
Smart Scad screen design

02The goal

Smart Scad had to serve two very different audiences:

  • Employees needed to complete their operational work quickly.
  • Management needed to see the performance of the organization and its people to make informed strategic decisions.
Smart Scad screen design

03Research

Before designing anything, I needed to understand how employees and management worked today and what they would need in the future.

What I explored

  • Management: How do they see the organization, and what would make them more effective in their roles?
  • Employees: What are their current and future needs, and how do they see team performance?
  • Organization: What are the strengths and gaps in structure, processes, technology and culture?

How

I interviewed employees and department and section heads about how they assign, complete and track work, and mapped how everyday requests moved through the existing stand-alone tools.

Key findings

Both groups said they wanted the same thing: to save time and perform better day to day. But the research showed they struggled in different ways.

  1. Too many tools for simple requests. A single request, such as short leave, meant using several separate systems and manual approvals.
  2. Managers lacked visibility. Department heads had no real-time view of task status, so they relied on emails and meetings to check progress.
  3. Work was reactive, not planned. Much of the daily work arrived as ad hoc requests, with no link between individual tasks and the organization's strategic goals.
  4. The two groups needed different things. Employees wanted speed and fewer steps; leadership wanted a high-level summary with the option to dig deeper.

04Approach

I gathered design requirements from user feedback and split every possible user flow into two groups: flows for employees and flows for management.

While the development team began their work, I mapped each scenario for both groups and designed the simplest possible flow for each one, answering questions like:

  • How does a manager assign a task to a teammate?
  • How does the teammate receive it?
  • How does the manager track daily task completion?

05Key design decisions

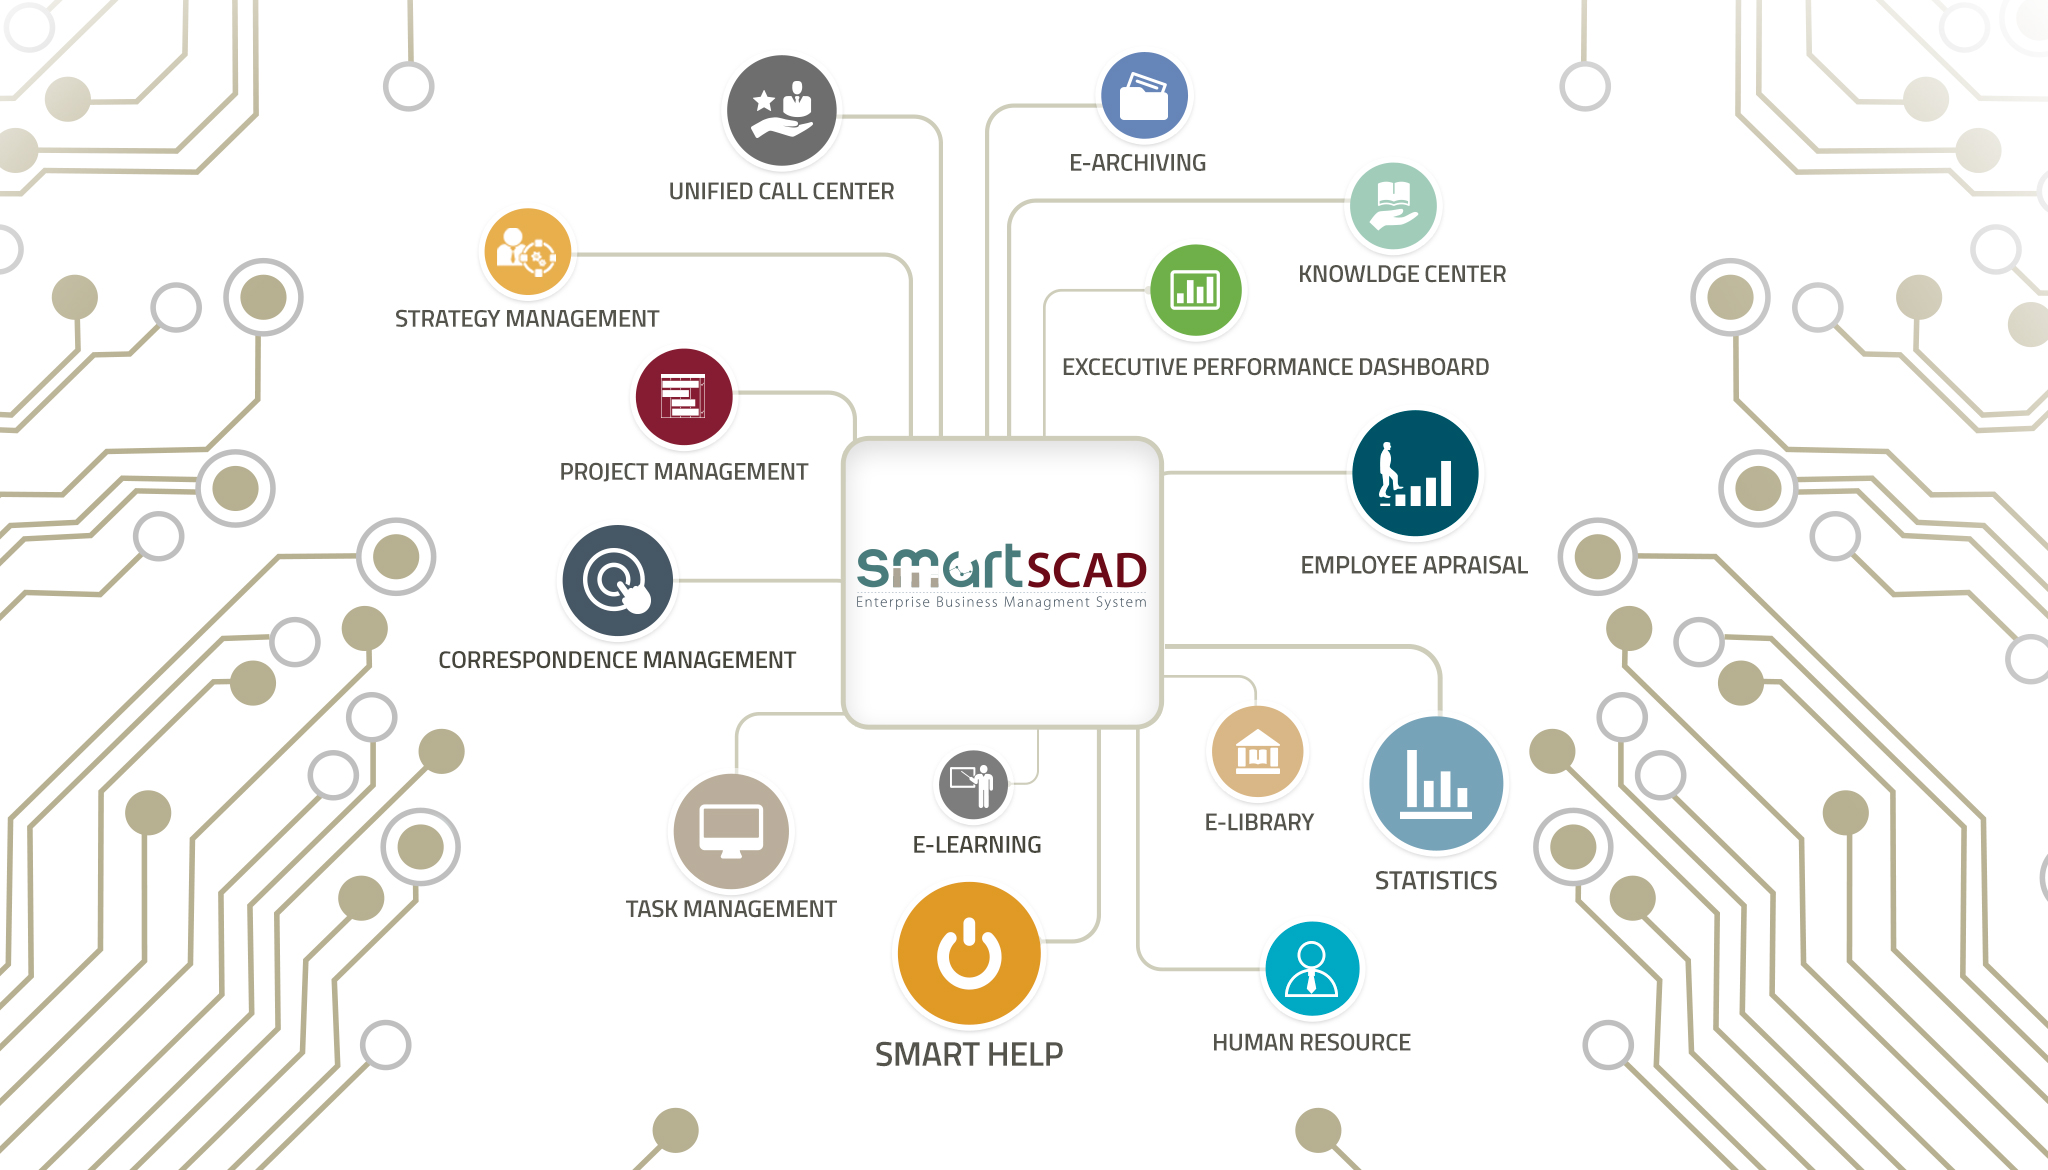
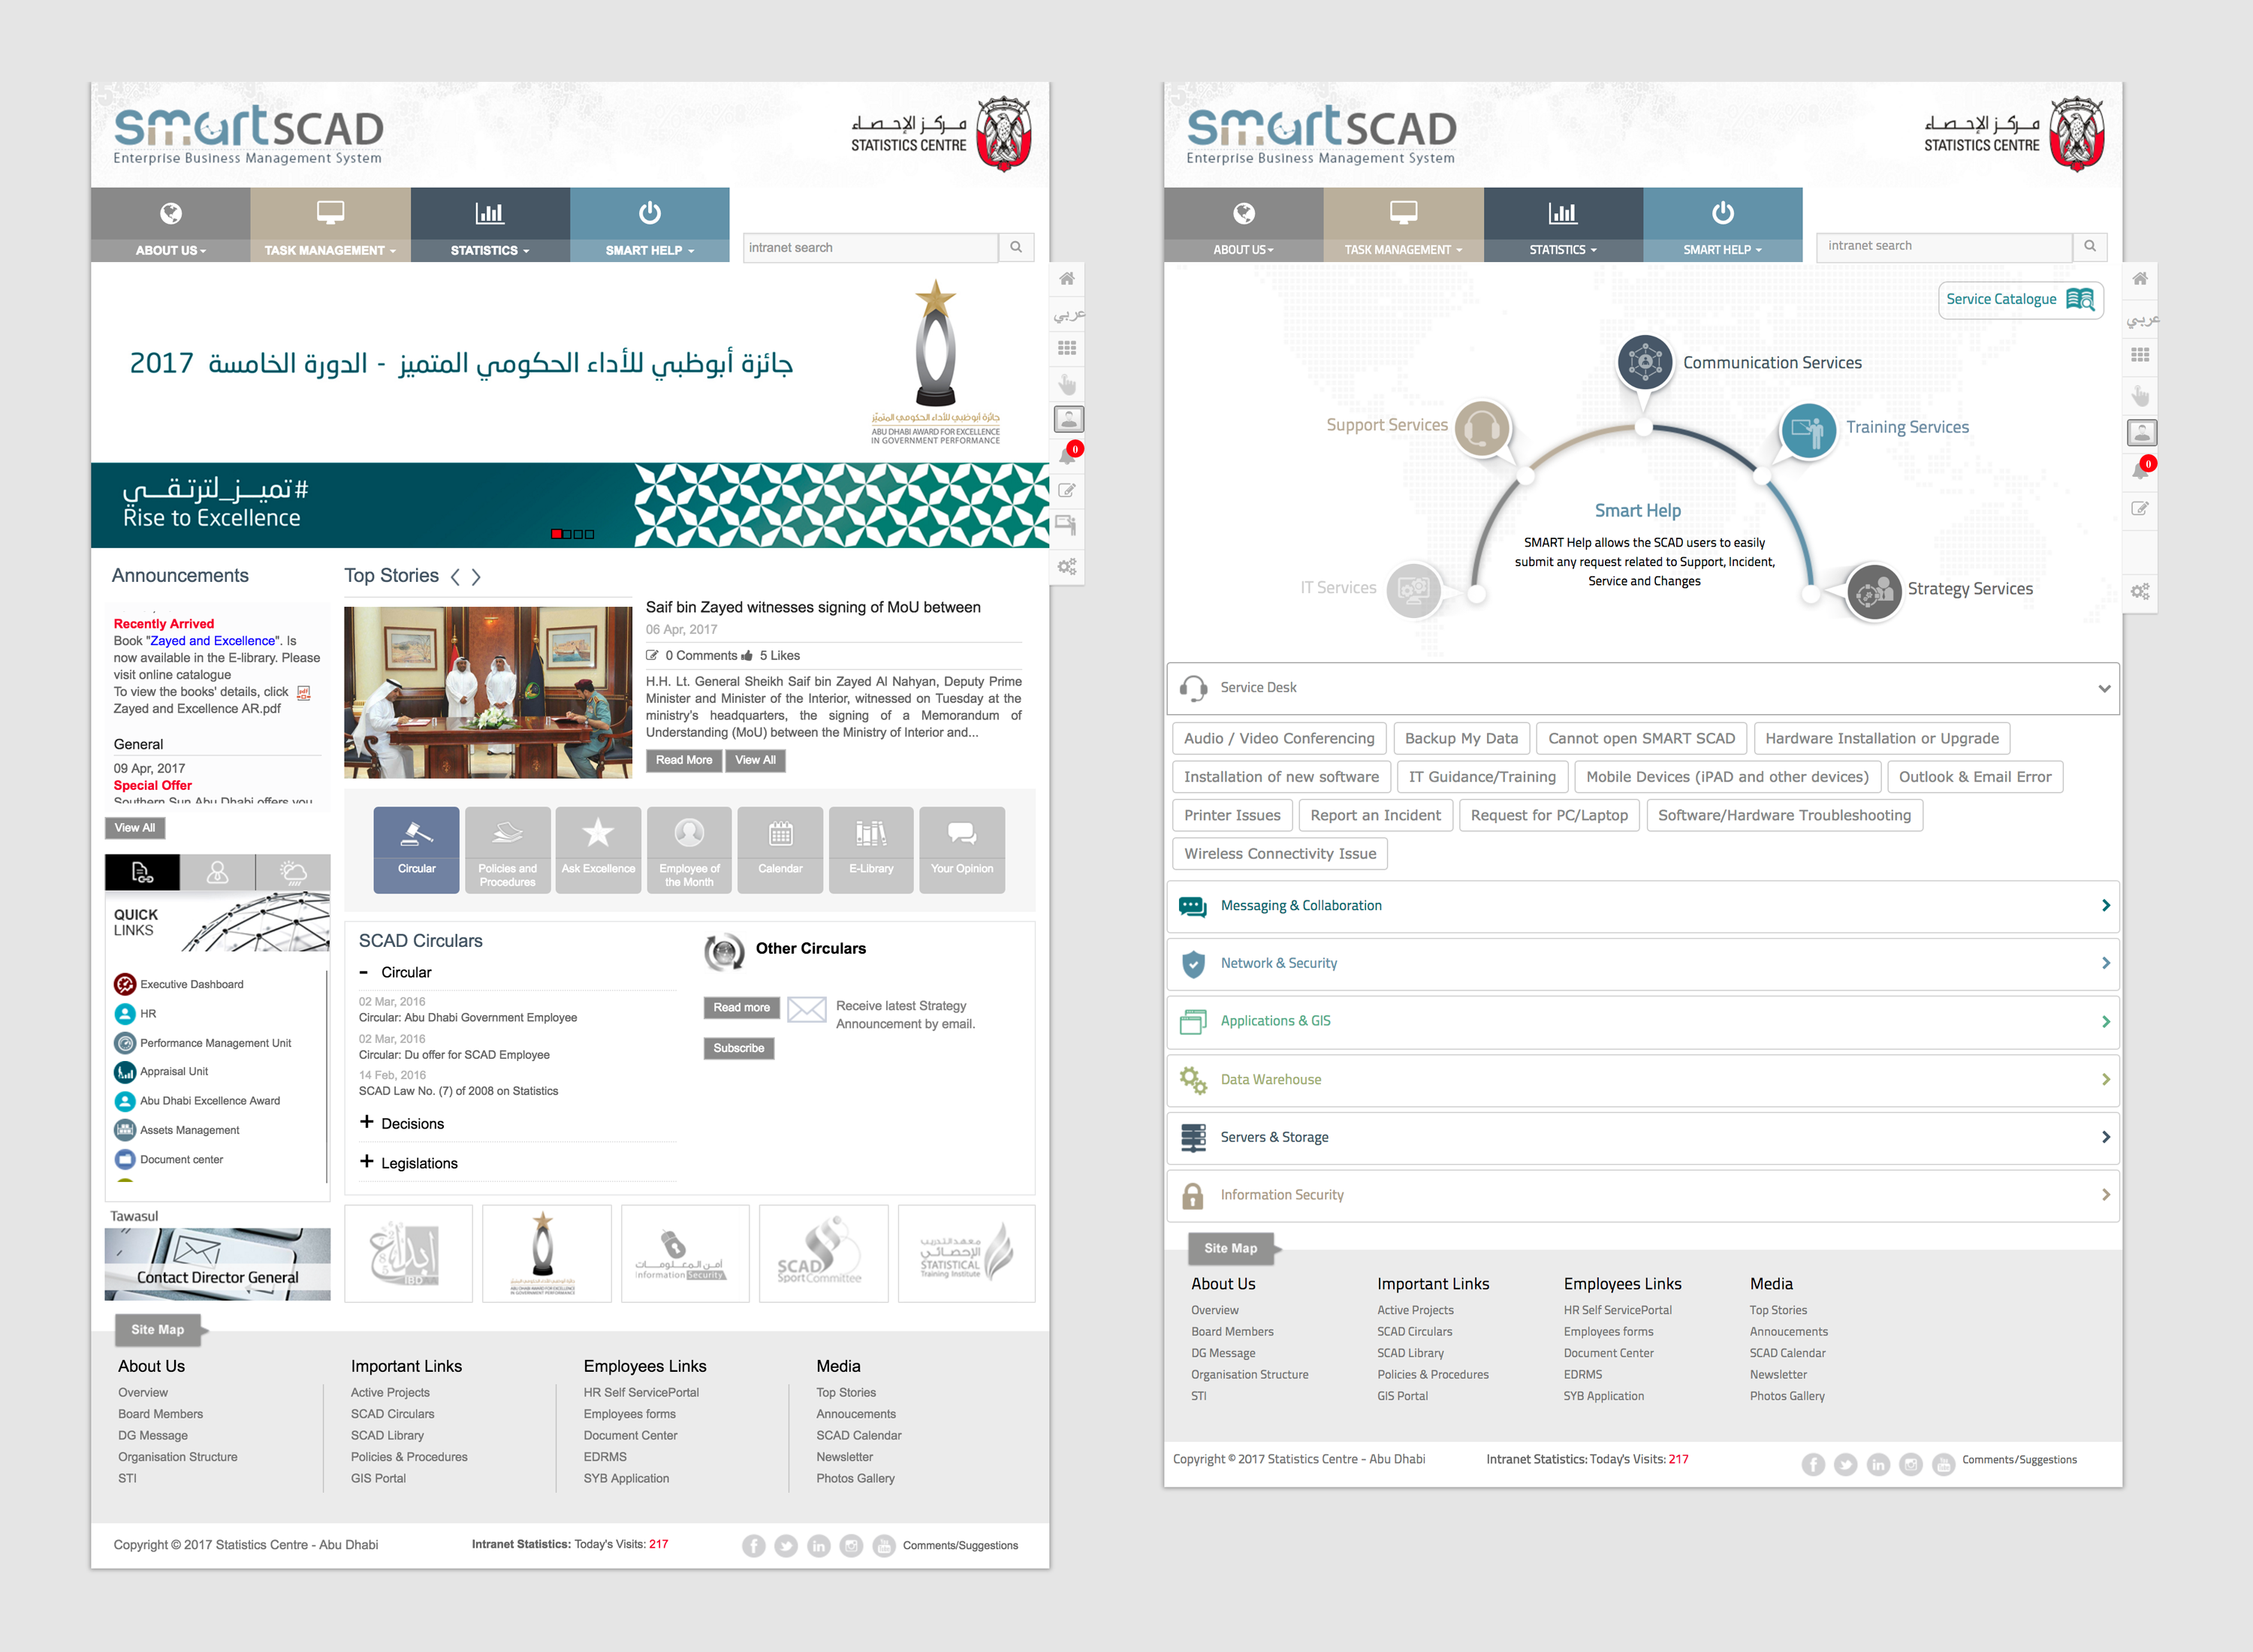
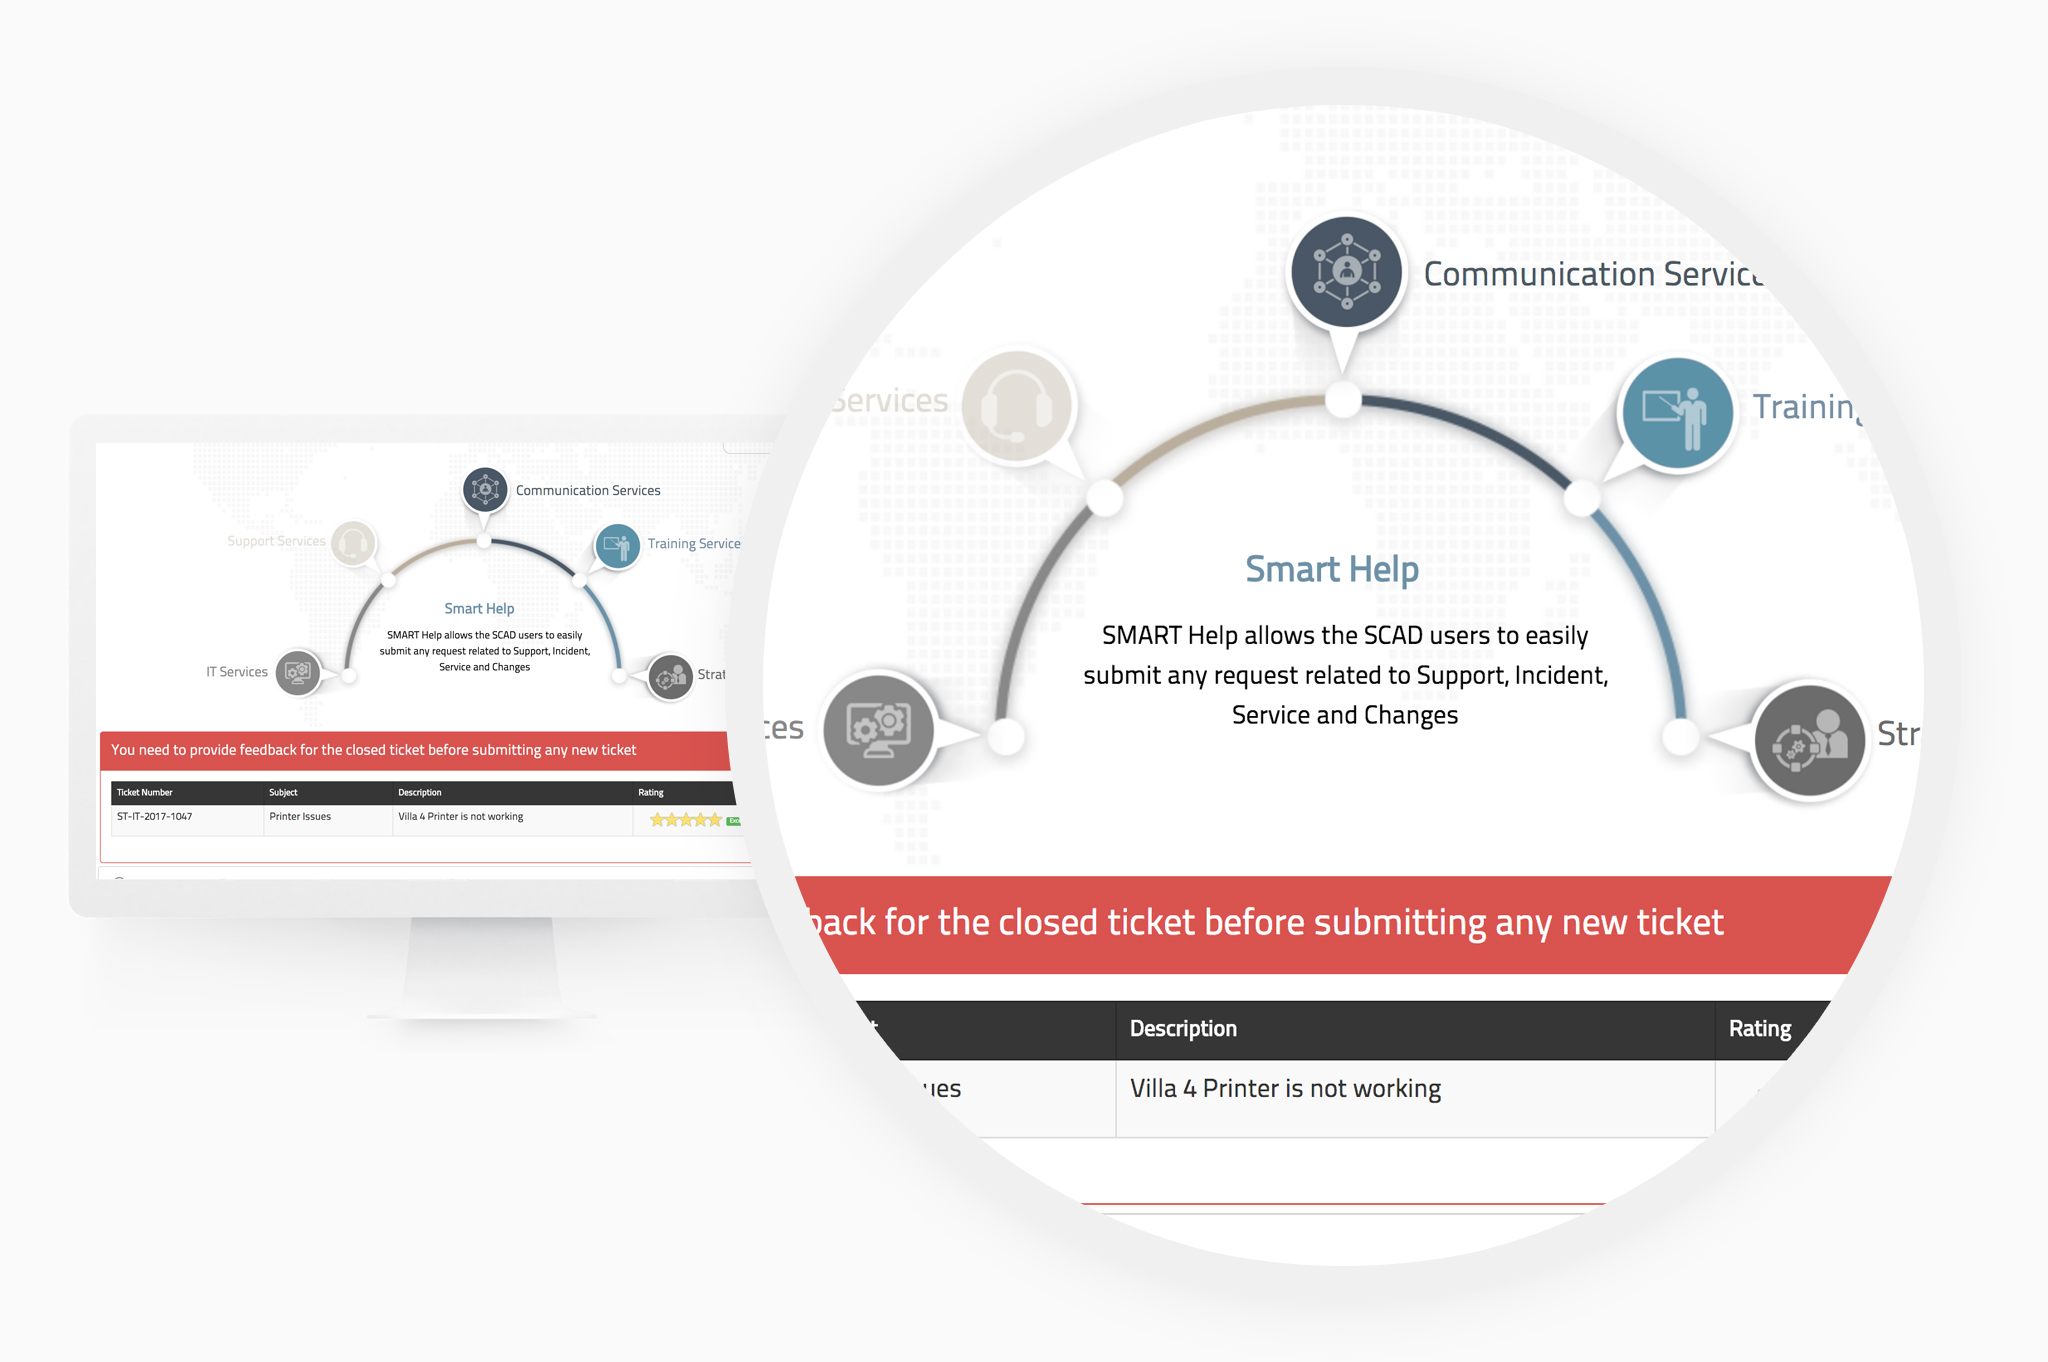
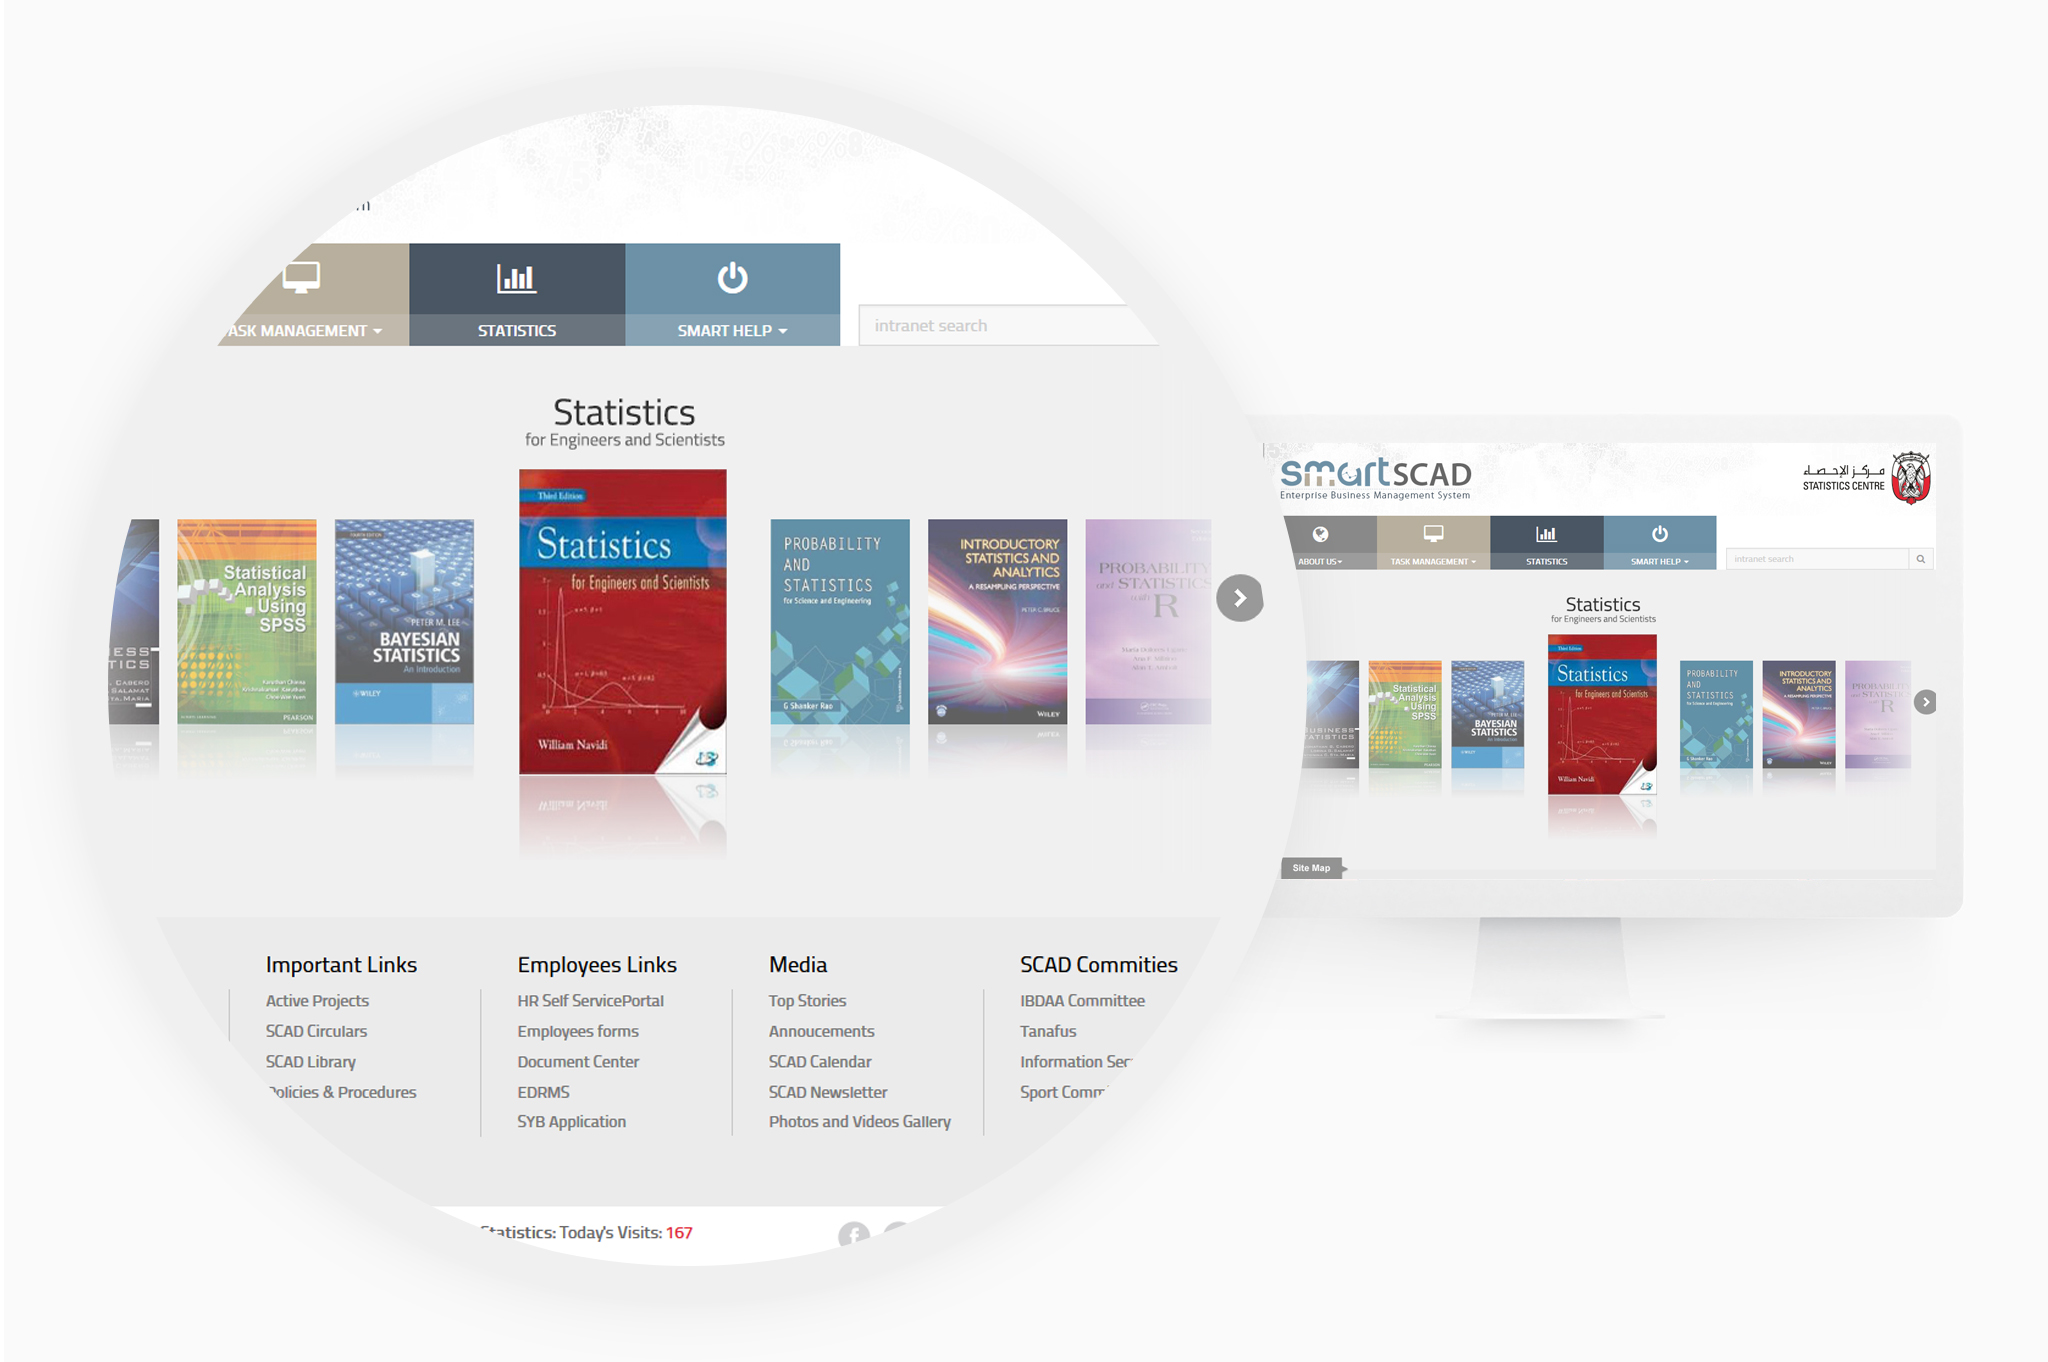
1. One interface for everything. Rather than improving each tool separately, I designed a single interface where everyone, from staff to management, could reach all internal applications and services.

It brings together task management, the helpdesk, project management, recruitment, appraisals, a 360-degree dashboard and other HR, admin and IT services.

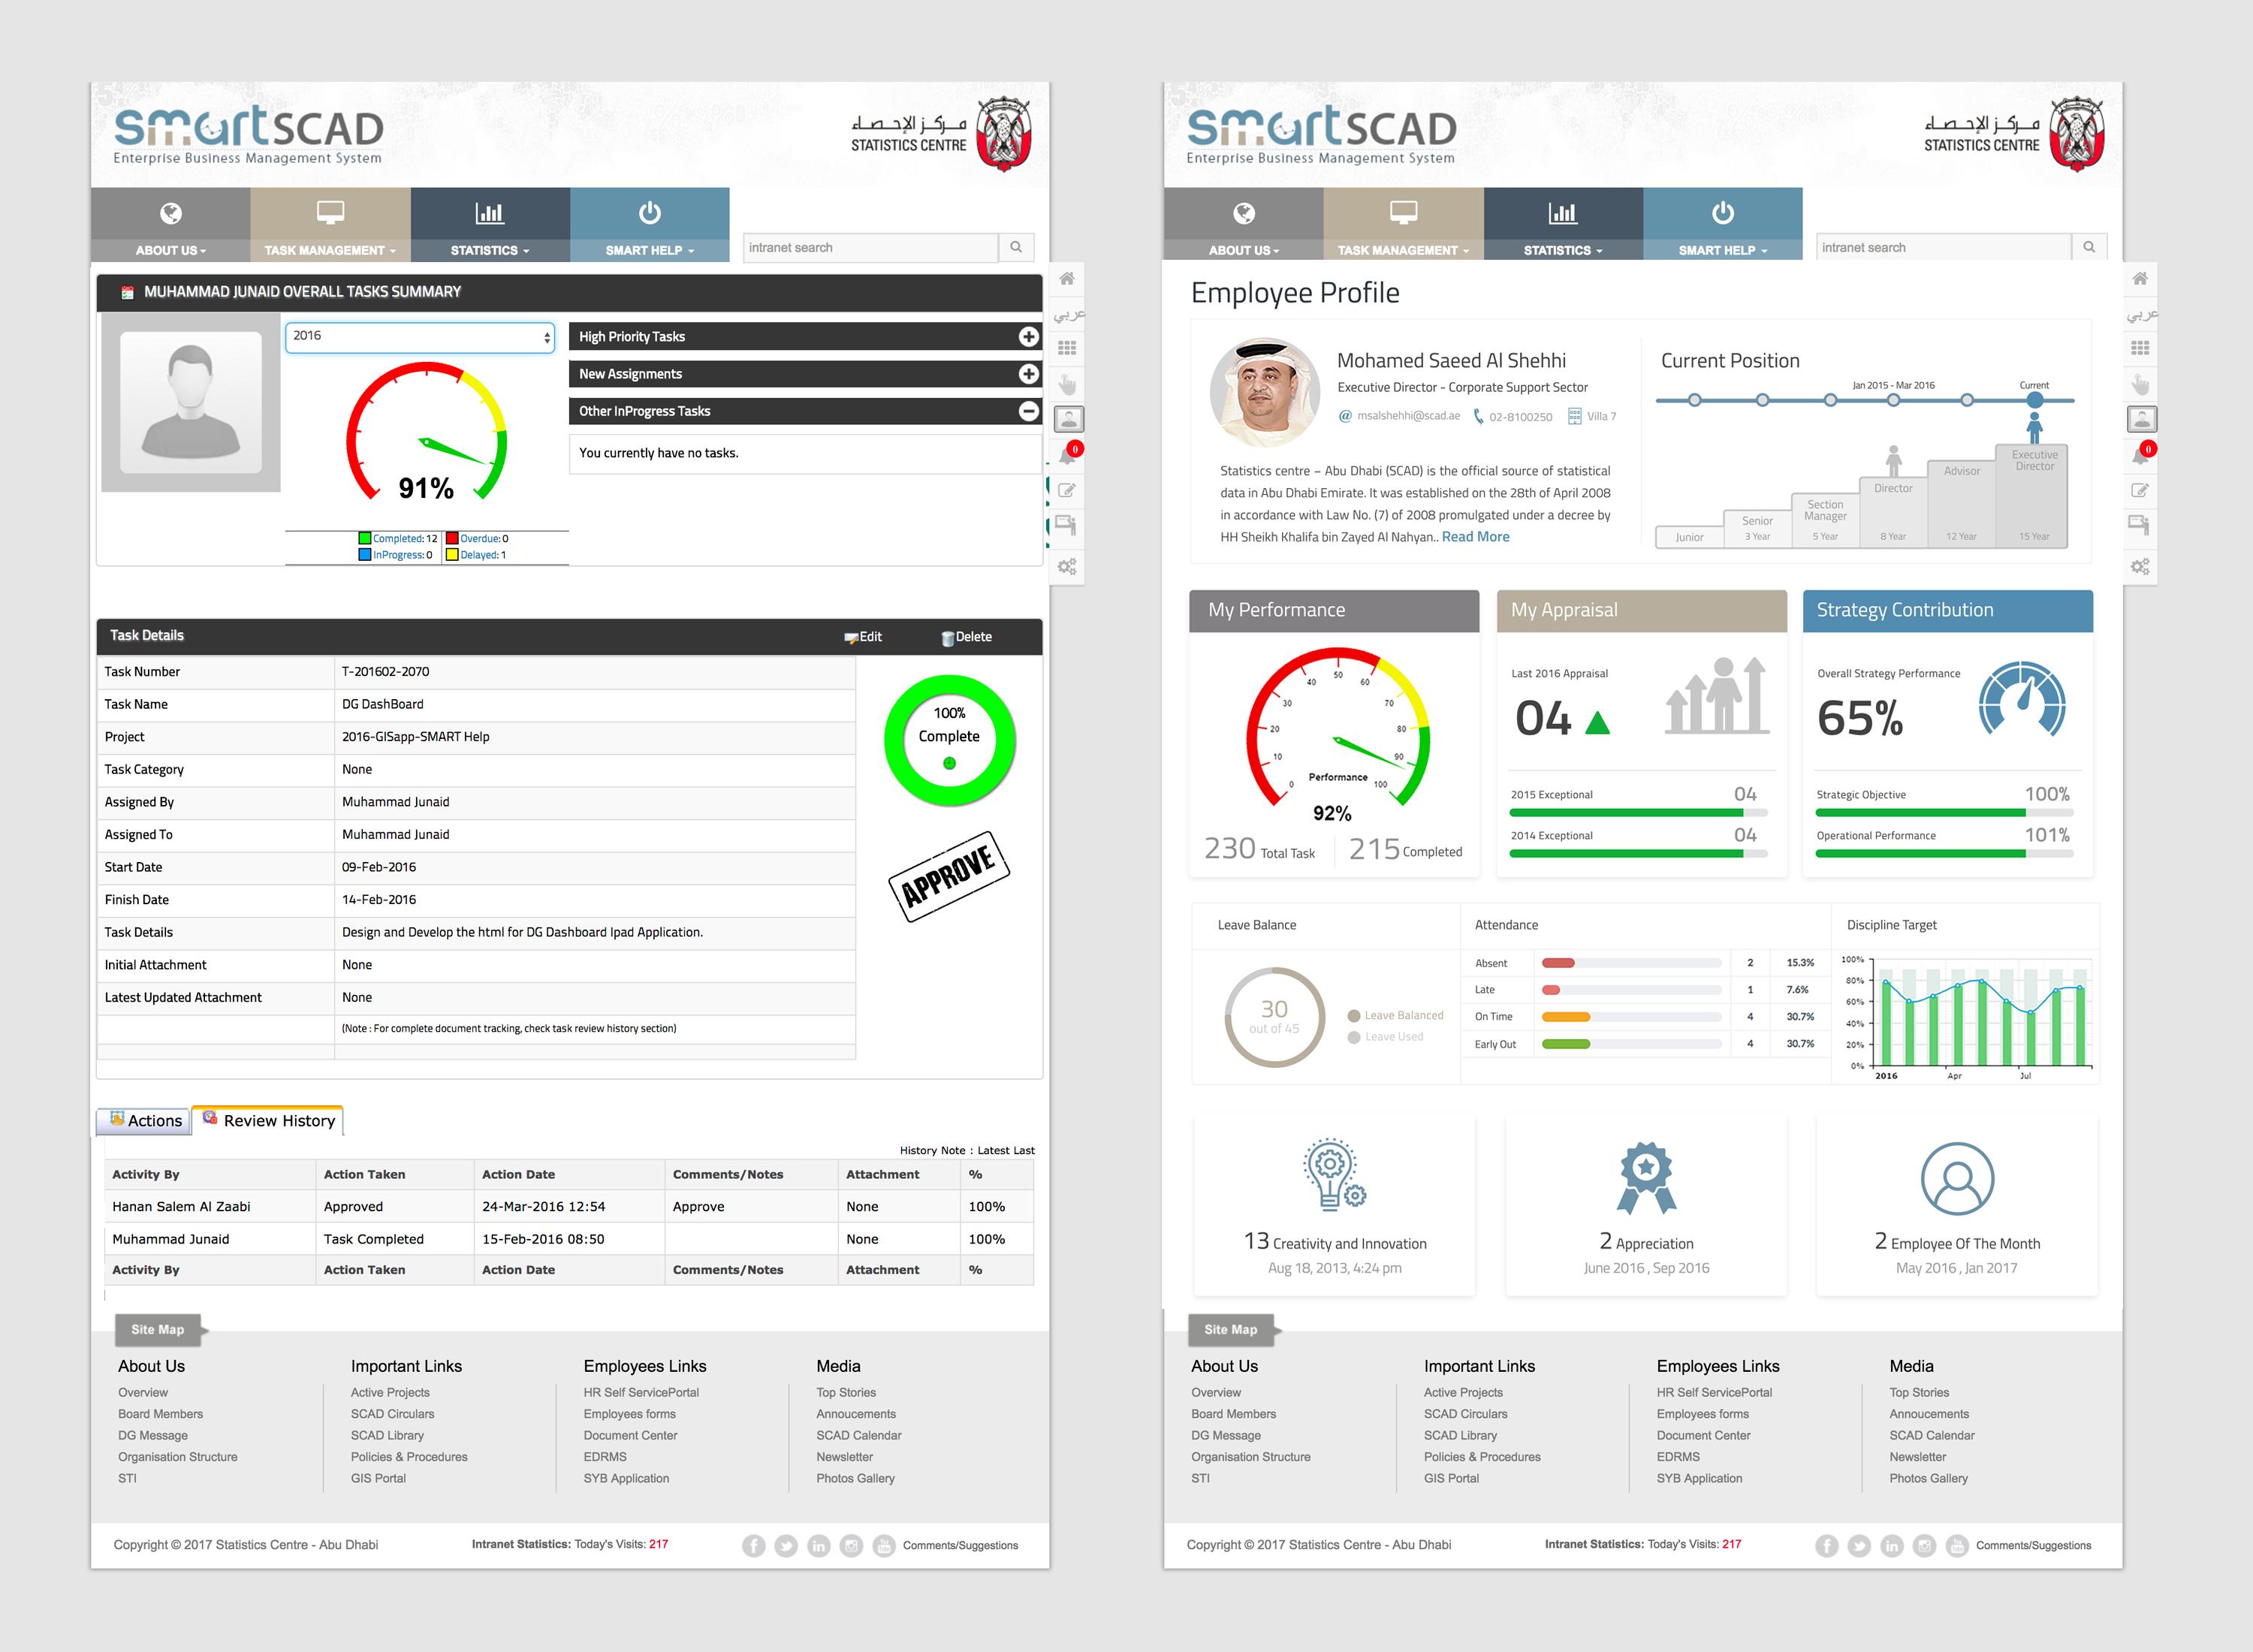
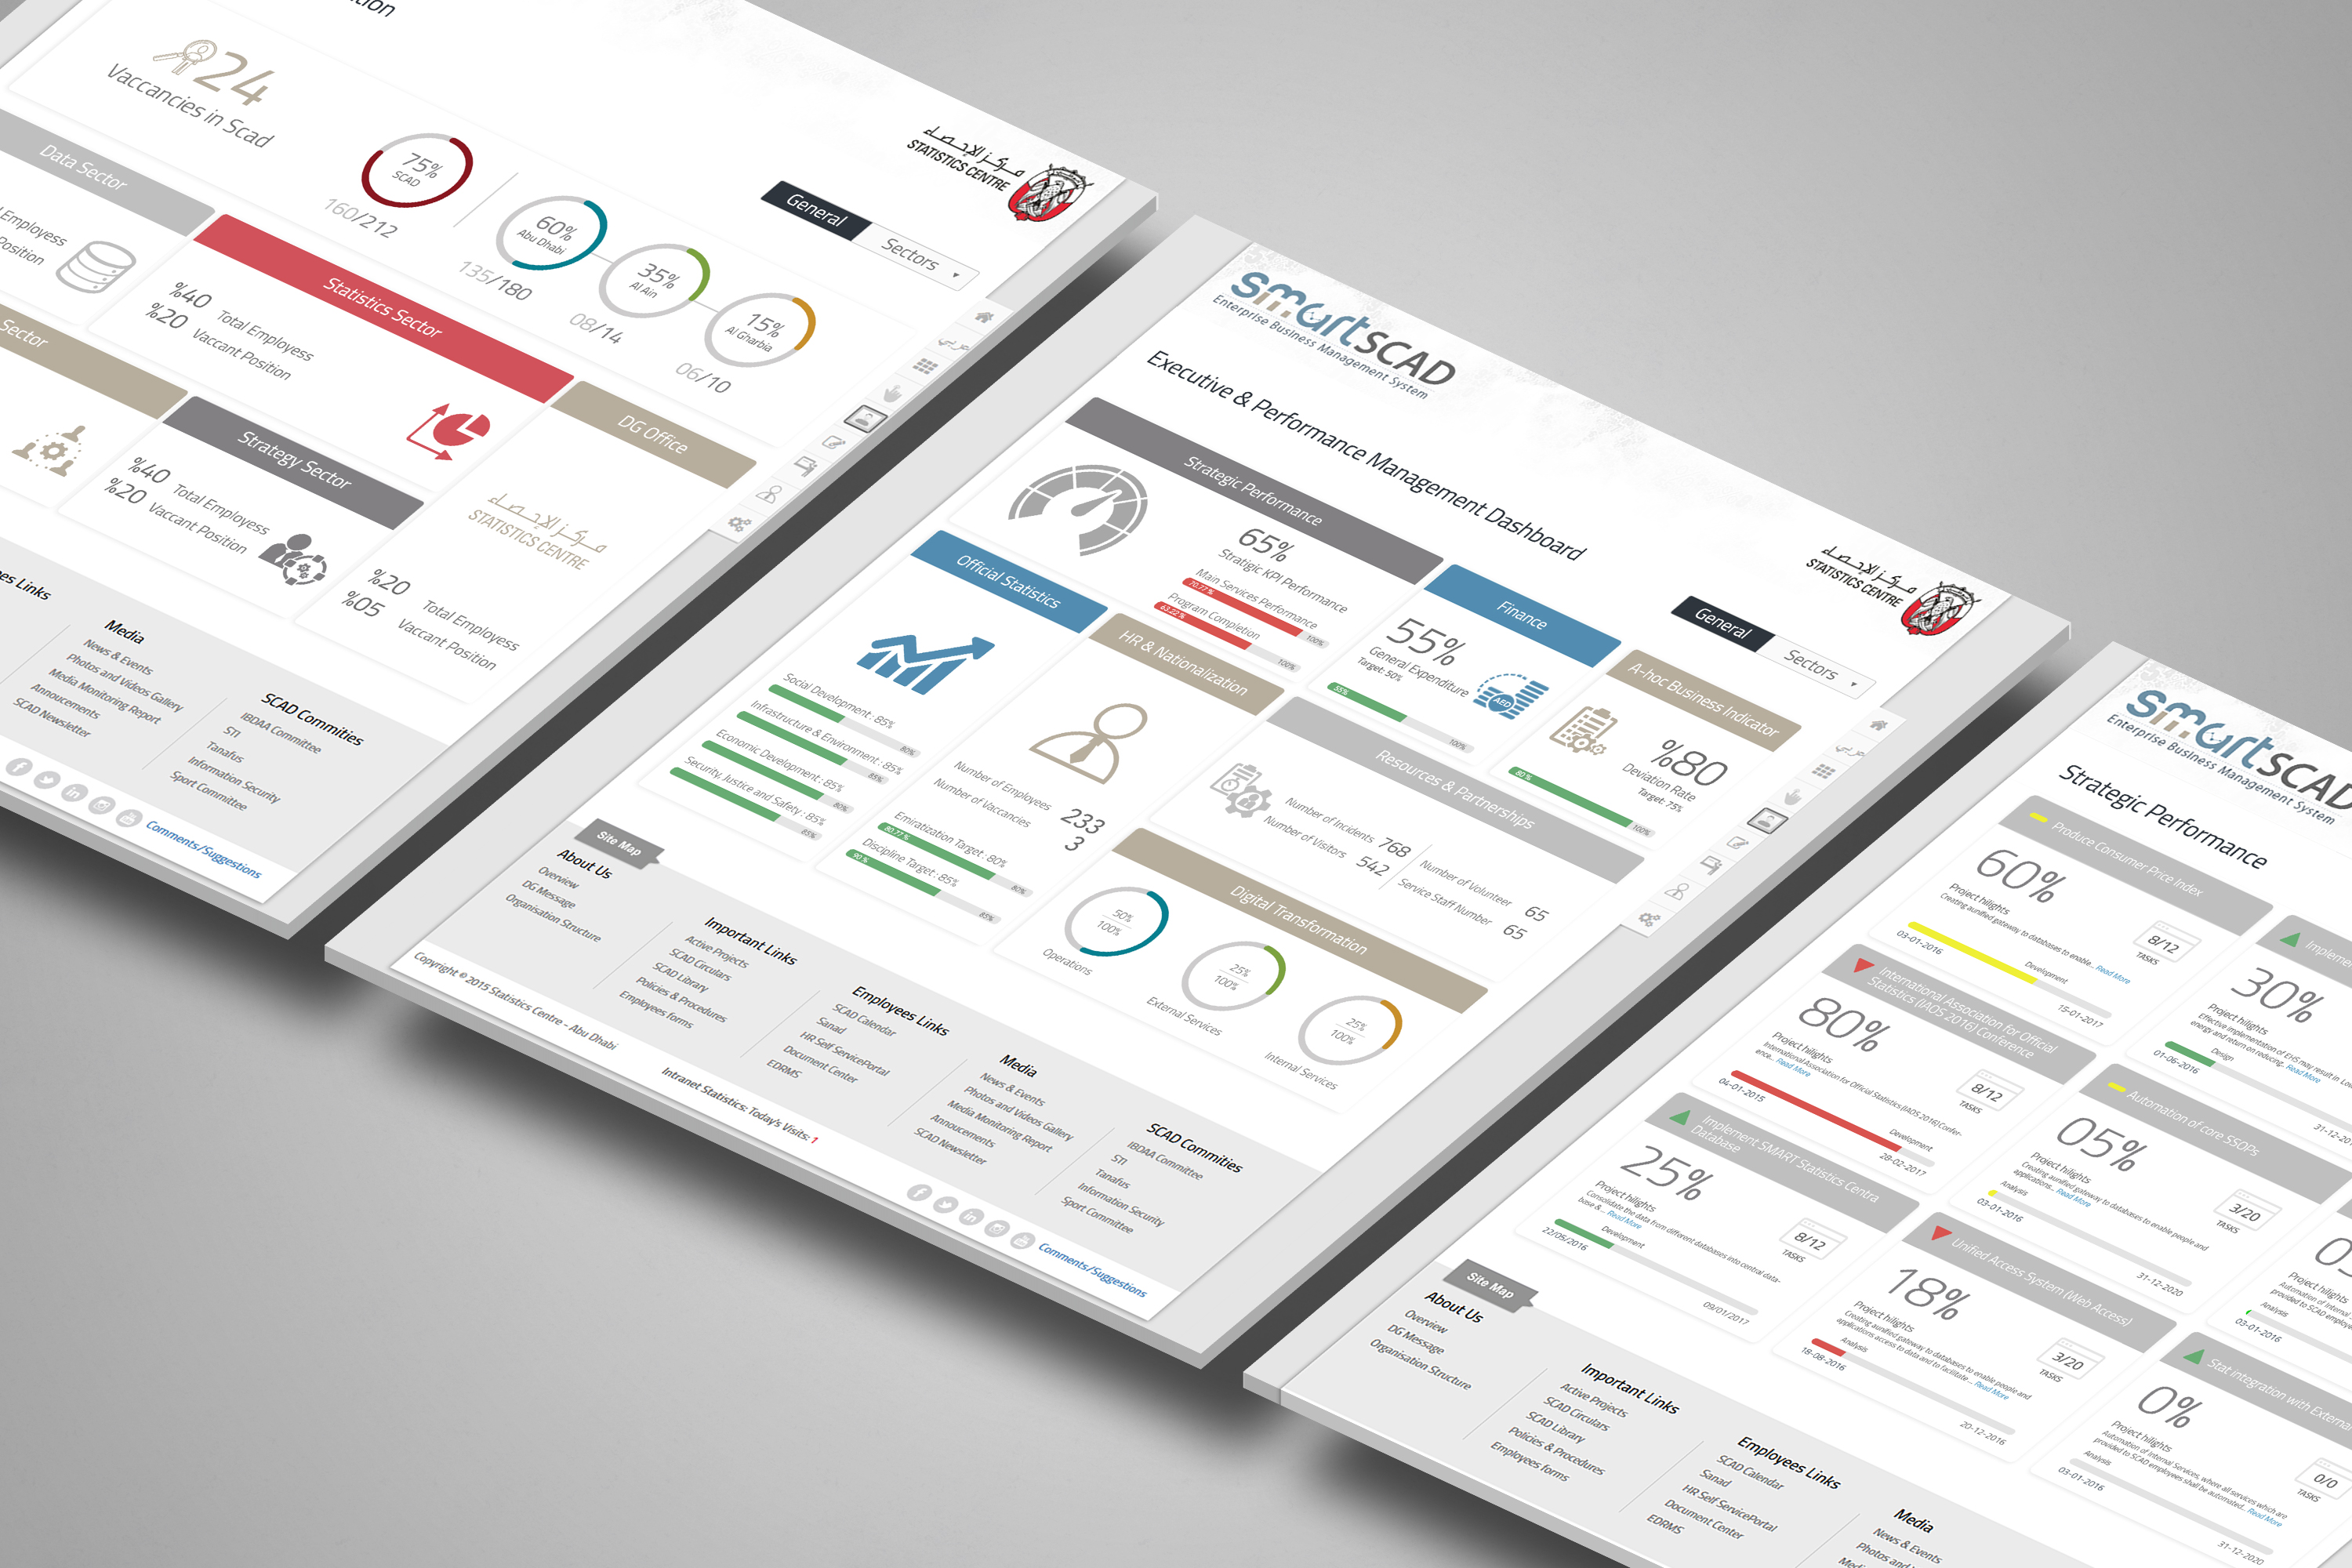
2. Summary first, details on demand. Leadership needed to understand the organization's performance at a glance, but standard data tables overwhelmed them. After several rounds of testing, I designed a single-page summary for each category that shows only the most critical insights as charts and maps. Leaders can drill down into details only when they need to.

Smart Scad single interface for internal services

06Ideation & iteration

As I finished gathering requirements, I sketched rough user flows and early screen designs to get feedback quickly, balancing user needs with business needs.

Several rounds of rapid wireframing and high-fidelity design showed how hard it was to keep essential tasks simple and one level deep. This work helped me decide which design patterns made sense and how users should move between screens.

07Testing & the leadership summary

The summary view for each category took multiple rounds of user testing and iteration. Along the way, I worked with the data visualization engineering team to define new features for them to build, such as graphs and maps.

Each round of testing helped cut the summary down to the insights leadership actually used, making the final design simpler and more visual.

Final screens

Smart Scad final screen design

08Results

12+ Internal services brought into one interface
0 Dedicated training needed to start using it
2 Tailored experiences: one for staff, one for leadership
  • No dedicated training required. Staff and management could use the system from day one.
  • Praised by leadership for its clean, simple and attractive interface.
  • Large amounts of data, clearly presented. Despite its simplicity, the leadership summary presents complex data more clearly than standard data tables could.

next project

United Airlines Mobile App